
DIS Long-term outlook
After three months of winners, DIS bull takes a breather and hovering between $108.58 – $111.99 in February. The range is very tight with only $3.41 range and might continue in March. The first half of March has been a cautious month for DIS as the price move between $110.04 – $111.80 range.

This week, there is The Fed interest-rate announcement which might move the market and give volatility in DIS shares. Traders could expect either sharp reversal on share price as the Fed expected to increase the rate 75-100 bps or a continuation above resistance area.
There is the political issue as DIS CEO Bob Iger questioned for his decision to stay inside President Trump business advisory board. While it might not influence the company in short-term, but the investor might see this negatively in long-term if the company tilted into politics.
Click here to see DIS February analysis
New Month
Monthly chart
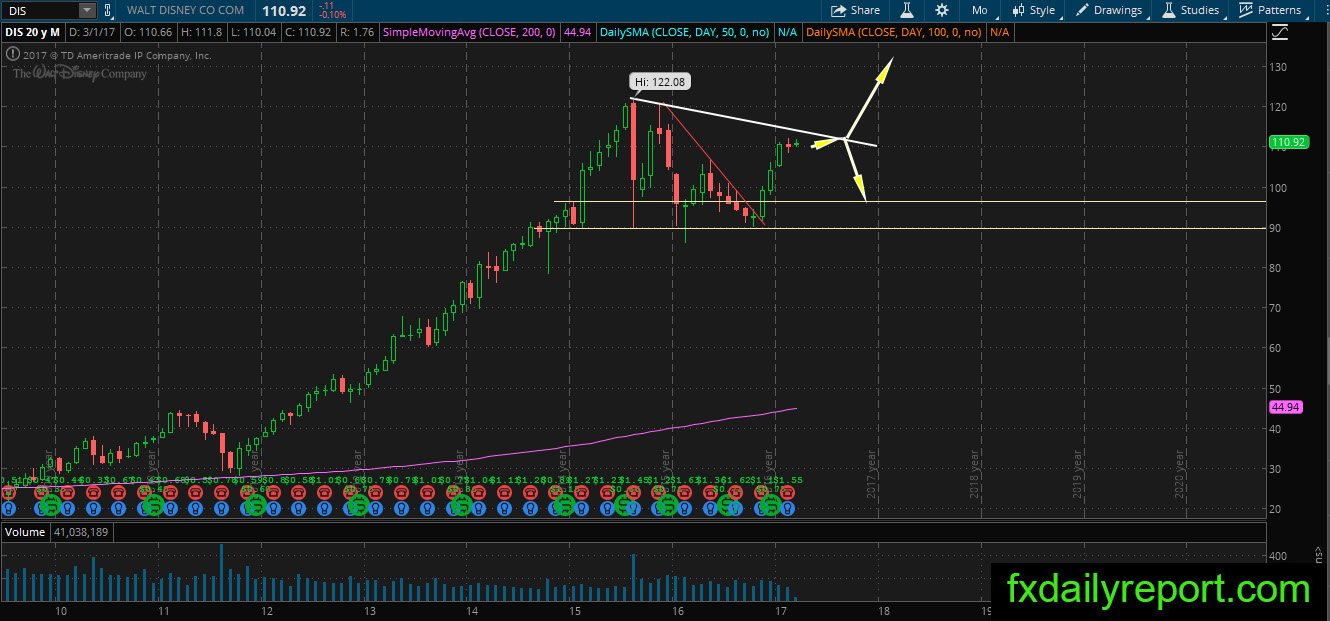
Roadblock is seen on DIS monthly chart as the price getting closer toward its trendline resistance. The price movement has been soft in February and first half of March where market waits for The Fed interest rate decision. The Fed schedule to increase rate three times this year and the first rate increase might happen this week.
If the price rejected at trendline, it might move down toward $90 – $97 support area.
Weekly chart
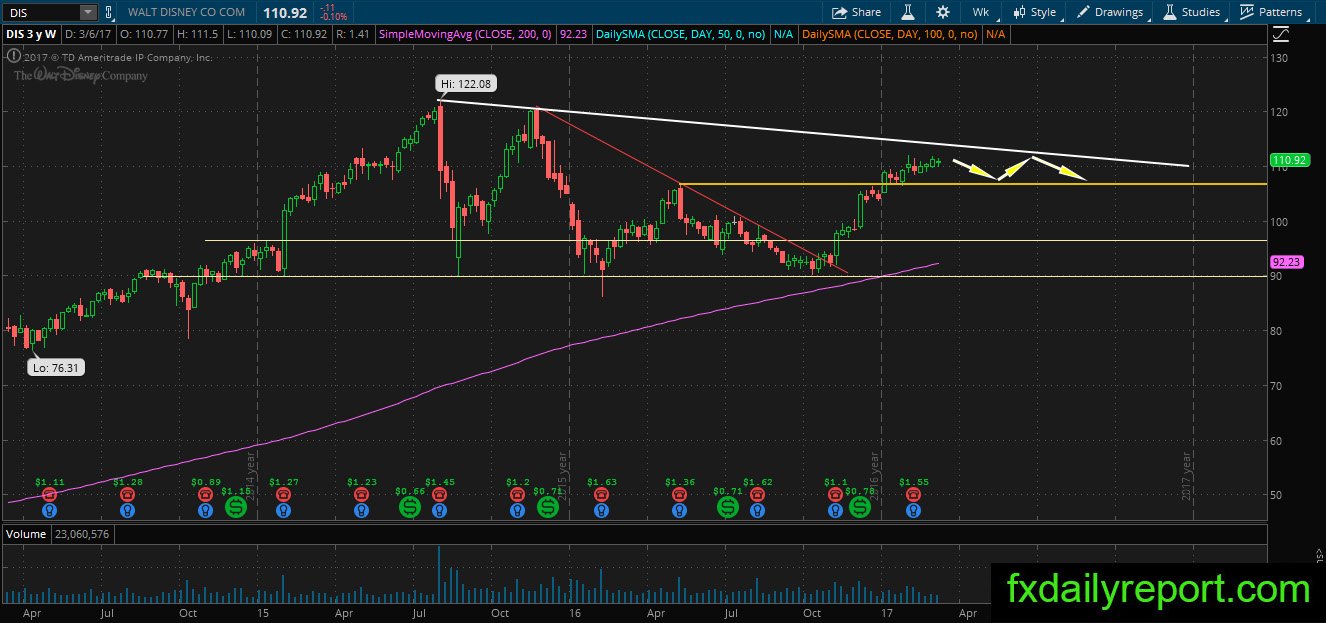
DIS on weekly chart move inside triangle pattern between white trendline and also $106 support level. The price might move sideway inside the range this month testing both sides.
Daily chart

The daily chart of DIS show consolidation under progress. The price trapped inside the bullish triangle and favored to break upside. On the upside, there is bearish white trendline which will cap the upside movement. $111.50 is the resistance the bull need to break. On the downside, $106.7 will act as support level when the share price is moving down.
Trade plan
The bullish position needs to wait either break above bearish white trendline or until the price reaches $90 – $97 support area.
The bearish position needs to wait until the price move near the white bearish trendline and formed bearish formation.