
DIS Long-term outlook
DIS share prices have struggled for years under deadweight ESPN which slowly lost its subscriber. The company had more than 100 million subscribers in 2011, but at the current time, the number estimated around 87 million which is down almost 13 million in 6 years.
However, the company did not stand and do nothing. There are two new streaming services planned to be launched. The first one is complementary services for ESPN subscriber. Another one is the service which includes creation from Marvel, Disney, Lucasfilm and Pixar studios.

Recently, the company cheered on extremely successful box office movie “Black Panther.” According to box office tracker, the movie amassed more than $600 million in U.S and Canada. The hype might not end yet as the movie enthusiast waiting for Avengers: Infinity wars which are released next month.
Overall, DIS problem stays the same and this two years will be the time for the company to prove it could handle the loss of subscriber problem.
Click here to see DIS November analysis
New Month
Monthly chart
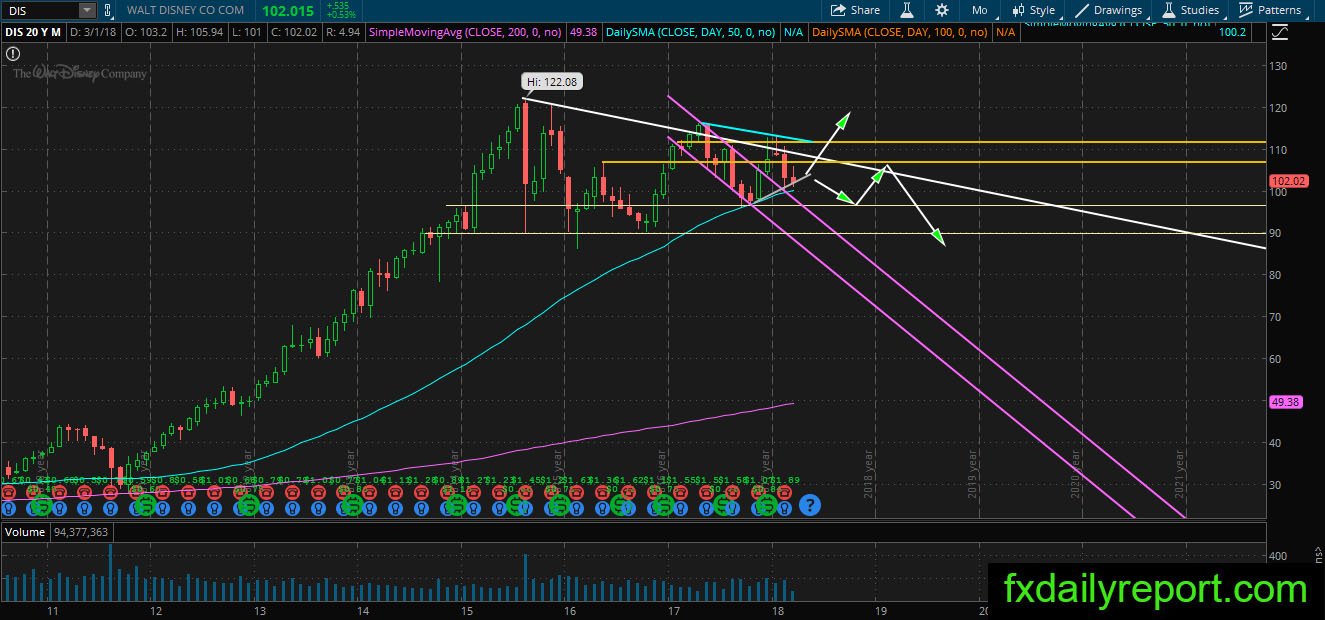
DIS on the monthly chart has escaped its bearish channel and moved higher. However, the upward movement immediately sold near the white trendline. The selling pushed the price down to the monthly SMA 50. There is no breakout below the averages and DIS expected to continue moving between the SMA 50 and white trendline.
Weekly chart
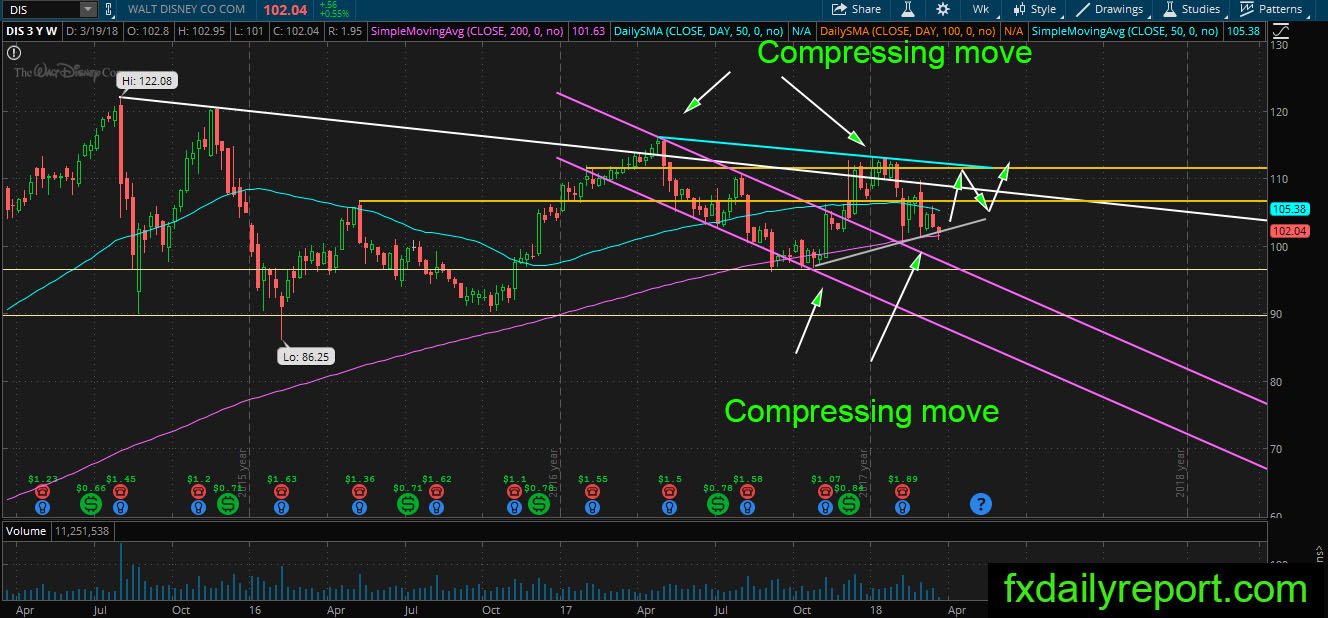
The trend on DIS weekly chart is more apparent as the prices move between two trendlines. The high gets lower, and the low gets higher which confirm the sideways trend. Currently, the price sits near the weekly SMA 200 and provide a chance for a long position. Traders could take the long position with the target at the blue trendline.
Daily chart

DIS on the daily chart is at a critical moment as the share prices slip below the uptrend line. The bull is currently attempting to bring the price back above the trendline. If the price stays below the trendline for several days, it is possible the bull has lost power and traders must ready for a bearish leg toward the purple channel.
Trade plan
Bullish trade, traders could look for long position when the share prices close above gray trendline on the daily chart.
There are two scenarios for the bearish position:
- Short position when DIS share prices could not close above the gray trendline.
- Short position at the blue trendline shown on DIS weekly chart after bearish pattern formed.