
DIS Long-term outlook
DIS share prices under heavy test by the bear before 9th November earnings report. The share prices loss $2.63 or 2.59% in September from $101.2 to $98.57. The trend continues bearish, since this year high $116.10, DIS share prices already lost 15%.
Next earnings report will be crucial for the company. Traders & investors are watching closely how the company manage its ESPN disaster. Will the company able to turn around ESPN division which weighed down the company?

Overall, October resume the bearish trend but the bull manage to hold decline and the share prices never move below September low. The month might close sideways and wait for November earnings trigger.
Click here to see DIS September analysis
New Month
Monthly chart
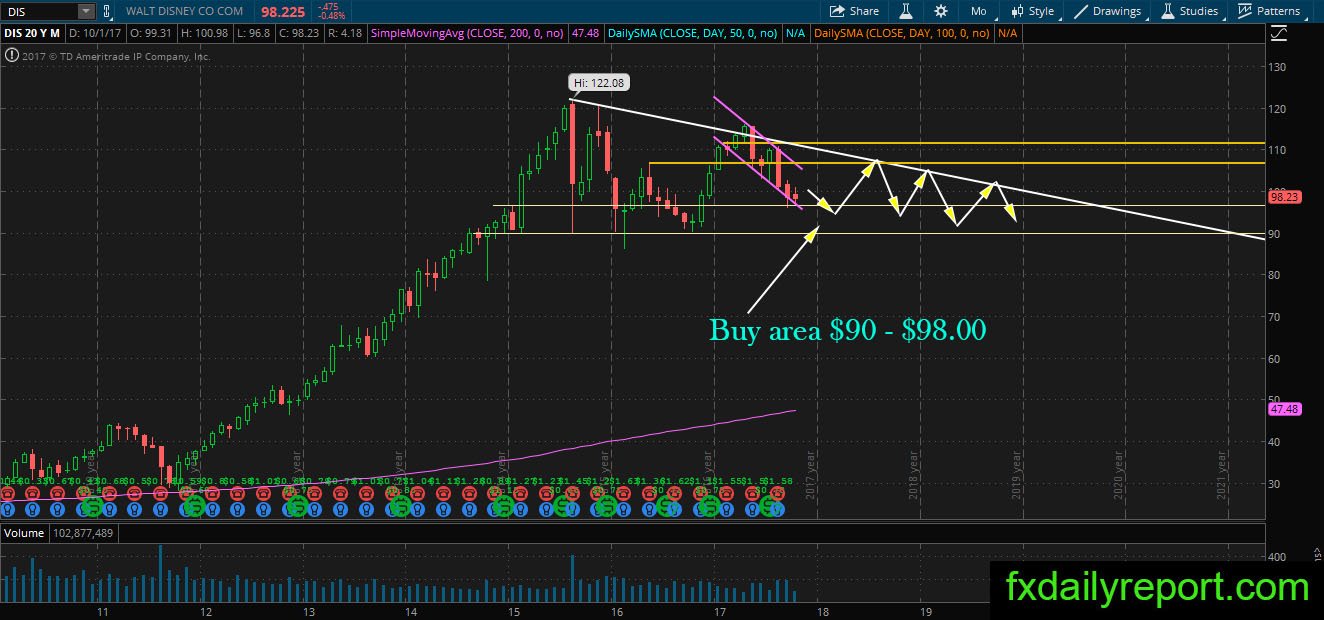
The movement of DIS on the monthly chart continue bearish and no sign of reversal yet. Currently, the share prices hit buy area between $90.00 – $98.00 where there is the possible bullish reversal. Meanwhile, it is better for traders to stay sideline and observe if the bull could stop the selling.
Weekly chart
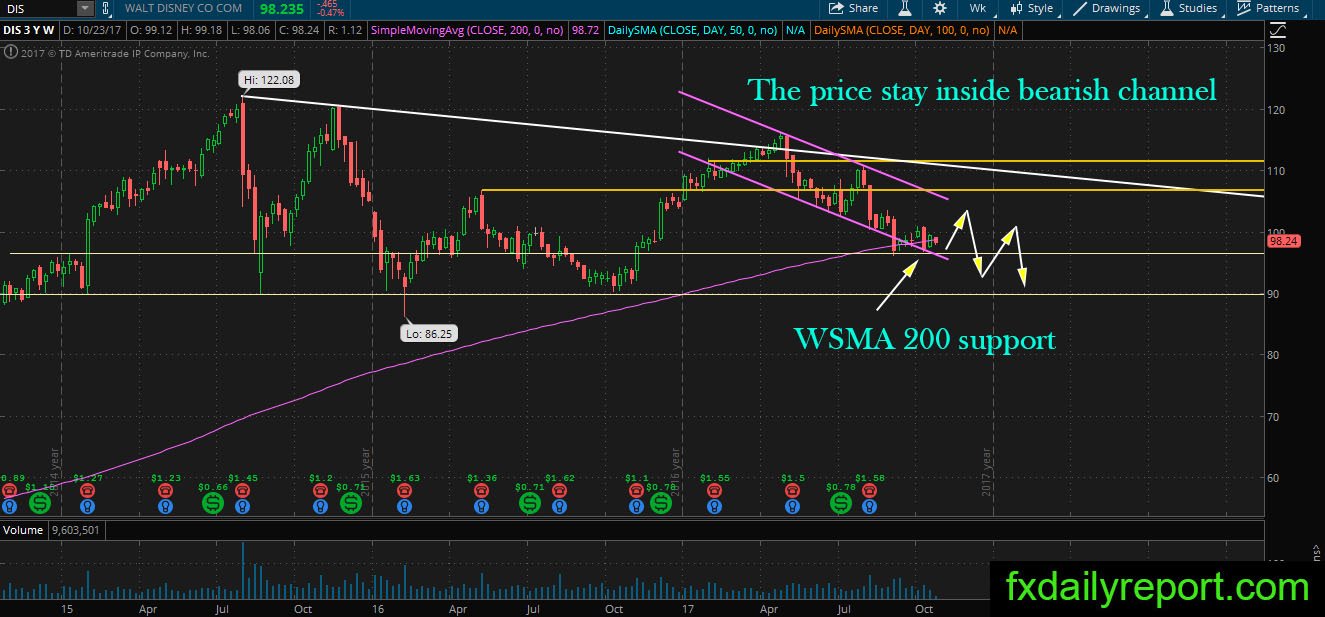
Lower into the weekly chart, and we could see the share prices testing the WSMA 200 support. No break or no bounce have been seen yet as the share prices moving back and forth. If the bull could print strong bullish pattern, DIS might start a new bullish leg.
Daily chart
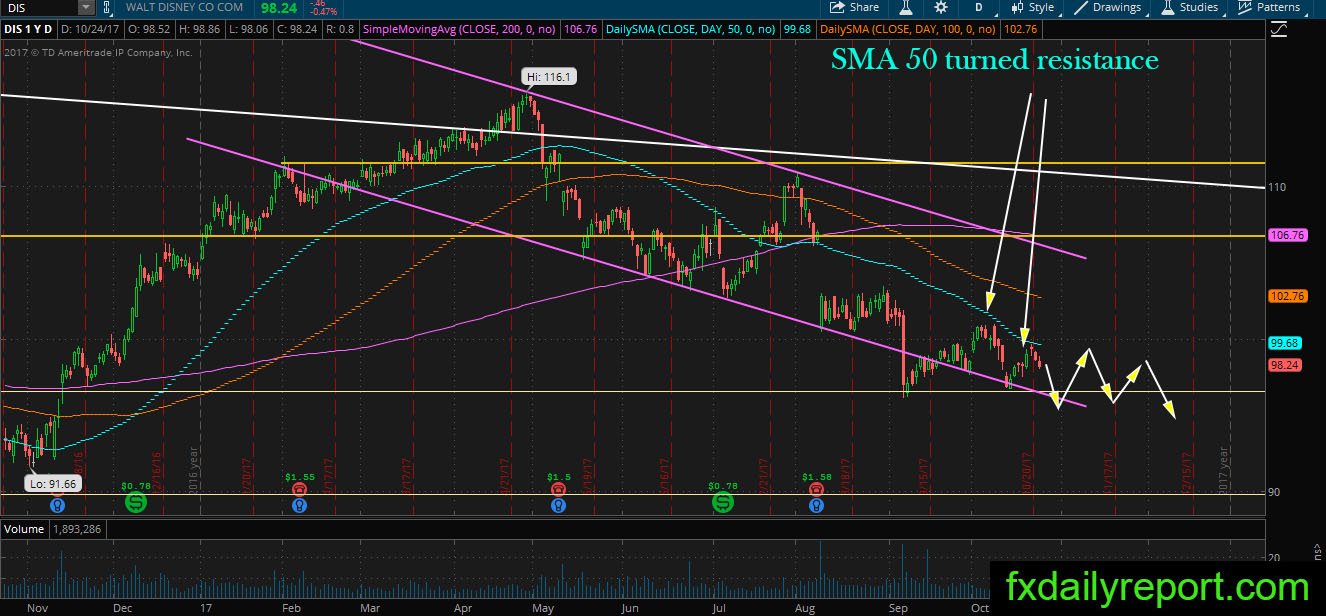
The direction on DIS daily chart continues bearish since the share prices broke below daily SMA 200. The bull attempt to move the share prices higher met with resistance at daily SMA 50. Without any change to the trend, DIS expected to continue its downward movement below daily SMA 50.
Trade plan
The bullish position might depend on how the bull defends $90.00 – $98.00 area. Strong bullish pattern inside this area might turn into the long-term bullish leg.
The bearish position could be taken from the daily SMA 50. Another location to look for the bearish position is the top of the purple channel.