
The price of WTI Crude Oil continued to trade in a consolidative pattern in a descending channel on Friday as downward pressure weighed in following this week’s storage changes. Oil price is trading at the back of a major rally last week that saw a trade gap form with the price rising to top $63.00.
The price of Light Crude Oil has since pulled back to erase that gap and it maintains a downward movement that could stretch through early next week albeit in a consolidative pattern formation.
WTI Crude Oil Fundamentals Overview

From a fundamental perspective, the price of oil is trading at the back of a mixed week in terms of economic data. Earlier in the week, the preliminary EU Markit manufacturing, composite and services PMIs missed expectations as did, the French and German PMIs, thereby resulting in a general bearish view of the EU economy.
In the US, the Markit PMIs (Manufacturing and Composite) beat expectations while the services PMI scored a miss. And on Tuesday, the US API Crude Oil stocks registered an increment of 1.4 million barrels up from 0.592M barrels from the previous week. On Wednesday, the EIA Crude Oil report missed expectations of -0.249M barrels with 2.412M barrels.
The US House Price Index beat with a 0.4% change versus 0.3%. The initial jobless claims for last week missed with 212K versus 211k expected while continuing jobless claims beat with 1.650M versus an expectation of 1.665M. The GDPPI also beat with 2.6% versus 2.4% expected. News that Saudi Arabia Oil supply is back in the market after the tensions in the previous weeks also weighed on the price of oil.
WTI Crude Oil Technical Analysis (the 60-min Chart)
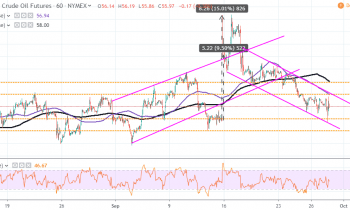
Technically, the price of oil appears to be trading in a bearish channel, which has recently begun to form a consolidative pattern. This could be signaling an end to the bearish run, which could trigger a rebound.
Therefore, the bulls will be targeting short-term profits at around $56.97 or higher at $57.93 while the bears will look to pounce at $54.59 or lower at around $54.0.
WTI Crude Oil Technical Analysis (the Daily Chart)
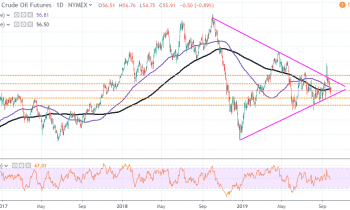
In the daily chart, the WTI Crude Oil appears to be trading in a consolidative symmetrical triangle around the $56.00 level. This could lead to a major trend reversal in the coming weeks.
Therefore, the bulls will target long-term profits at around $57.83 or higher at $60.14 while the bears will be looking to strike at around $54.00 or lower at $52.00.
In summary, the price of oil appears to be trading in a consolidative triangle formation, which could lead to a major reversal in the long-term trend but in the short-term, the bears appear to be winning the battle.