
The WTI crude oil price on Friday pulled back off the current 2-week highs of about $101.75 to trade at about $98.28. However, the light crude oil now appears to have found strong trendline support following the late pullback.
The oil price continues to trade within an ascending channel formation in the 60-min chart. It has now pulled back closer to the 100-hour moving average line, also recovering from the overbought conditions of the 14-hour RSI.
WTI Crude Oil Fundamentals Overview

From a fundamental perspective, WTI crude oil is trading at the back of a relatively busy period in the global markets. With the OPEC+ meeting next week, the WTI appears to have benefitted amid supply concerns. Moreover, the market is enjoying temporary optimism amid promising GDP data from Canada and Europe.
Although the US GDP fell for the second quarter in a row, essentially suggesting the country may be in a recession, other economic data remain strong. The core personal consumption expenditures price index came in stronger than expected on Friday, while personal spending and personal income also outperformed estimates.
On the other hand, the US API Weekly Crude Oil Stock for last week fell to -4.037 million barrels down from the previous week’s 1.86 million. The EIA WTI crude oil stocks change report also posted encouraging data with a change of -4.523 million versus a forecast of -1.037 million, down from the previous week’s equivalent of -0.446 million.
WTI Crude Oil Technical Analysis (the 60-min Chart)
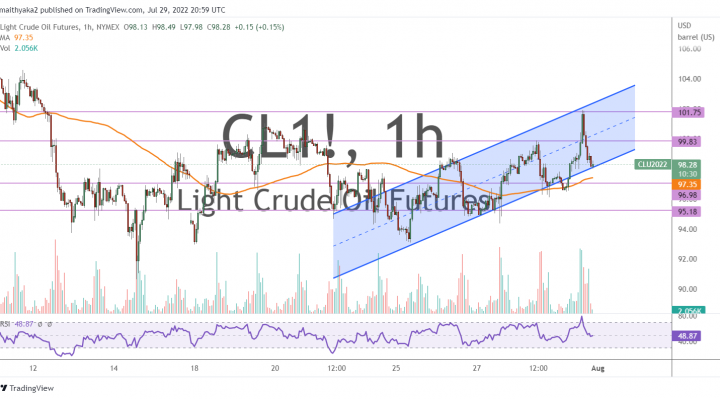
Technically, the light crude oil price seems to be trading within an ascending channel formation in the 60-min chart. This indicates a significant short-term bullish bias in the market sentiment.
Therefore, the bulls will be targeting short-term profits at about $99.83, or higher at $101.75. On the other hand, the bears will look to pounce on pullbacks at about $96.98, or lower at $95.18.
WTI Crude Oil Technical Analysis (the Daily Chart)
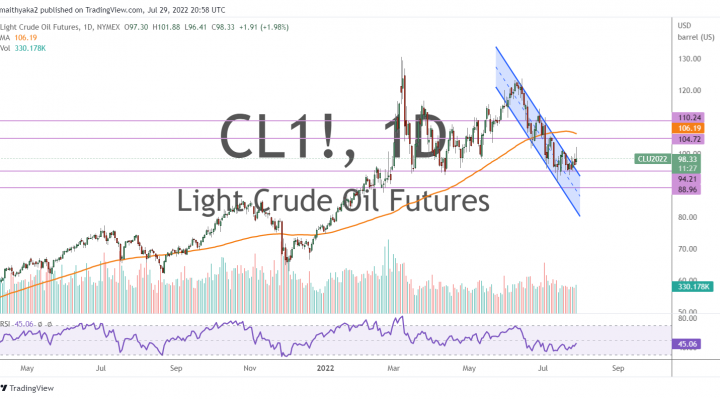
In the daily chart, the WTI Crude Oil price seems to be attempting a bullish breakout from a sharply descending channel formation. This indicates an attempt by the bulls to take control of the oil price.
Therefore, they will be looking to extend the current rebound toward $104.72 or higher to $110.24. On the other hand, the bears will be targeting long-term profits at about $94.21 or lower at $88.96.