
The price of WTI crude oil extended mid-week declines below the $60.00 level after rallying to top $62.28 earlier on. The price of light crude oil is now pinned between the 23.60% and 38.20% fib levels in the 60-min chart after ending an impressive rally in February.
The oil price has now dropped below the 100-hour SMA while the 200-hour SMA is a few levels below. It continues to trade very close to the oversold levels of the 14-hour RSI. This could trigger another rebound going into next week.
WTI Crude Oil Fundamentals Overview

From a fundamental perspective, oil is trading at the back of a relatively busy period in the global financial markets. The roll-out of the covid-19 vaccine appears to be gaining momentum. This is positive for oil prices amid expected resumption to normal business operations. The OPEC+ members maintained the current policy of output cuts for February, which again boosts prices.
In the latest rig count data, the US weekly API crude oil stocks data for the week ending February 12 showed a balance of -5.8 million barrels. This is a significant improvement from the previous week’s equivalent of -3.5 million barrels. The EIA WTI Crude Oil stocks change report for the week ending Feb. 12 also showed a positive change after posting a net change of -7.258 million barrels. The market was expecting a change of -2.429 million barrels. This compares to the preceding week’s change of -6.644 million.
WTI Crude Oil Technical Analysis (the 60-min Chart)
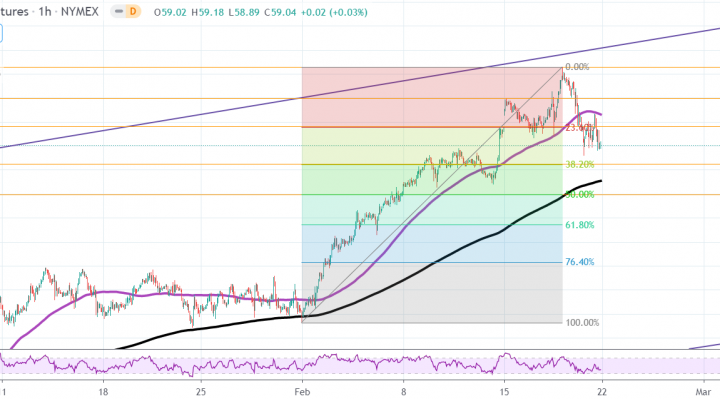
Technically, the price of oil appears to have recently pulled back from a 13-month high of $62.28 to trade at $59.04. It is now pinned between the 23.60% and 38.20% fib levels in the 60-min chart. This shows a significant shift in the market sentiment from bullish to bearish.
The bulls will be targeting short-term rebound profits at around the 23.60% fib level at $59.81 or higher at $60.99. On the other hand, the bears will look to extend short-term declines towards 38.20% and 50% fib levels at $58.24 and $56.97, respectively.
WTI Crude Oil Technical Analysis (the Daily Chart)
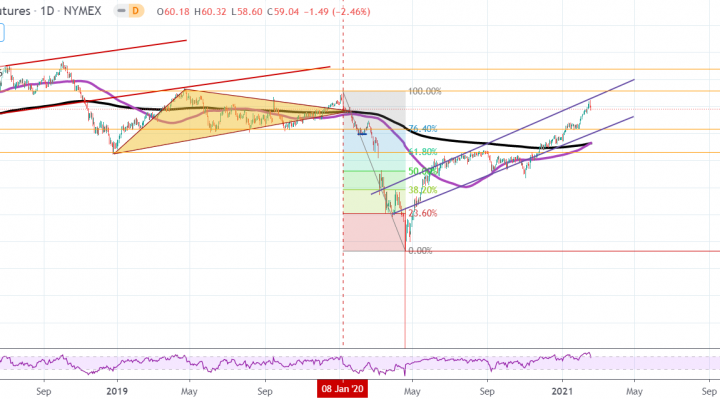
In the daily chart, the price of light crude oil appears to be trading within a gently ascending channel formation. This indicates a significant long-term bullish bias in the market sentiment. The oil price has now rallied to overbought levels of the 14-day RSI. The latest pullback could push it back to the normal trading zone.
The bears will be targeting long-term pullback profits at around 76.40% and 61.80% fib levels at $51.75 and $43.05, respectively. On the other hand, the bulls will look to extend current gains towards the 100% fib level at $65.67 or higher to $73.80.