
WTI crude oil has staged a notable breakout from a symmetrical triangle formation on the short-term time frame, suggesting that a measured move higher could follow.
Price has surged past the swing high near the $105.47 level, but a pullback to retest the former resistance zone could be in order before the rally extends further.

The Fibonacci retracement tool highlights the key levels where buyers could be lining up to join the uptrend. The 38.2% Fib sits at $102.35, which is the first area of interest and aligns closely with the triangle’s upper boundary that previously acted as resistance.
The 50% level at $101.38 offers an additional layer of support should the initial zone give way, while a deeper correction could bring oil back down to the 61.8% Fib at $100.41, a psychologically significant area near the $100 handle. The 100% retracement level at $97.29 marks the swing low and would represent a full unwinding of the breakout move.
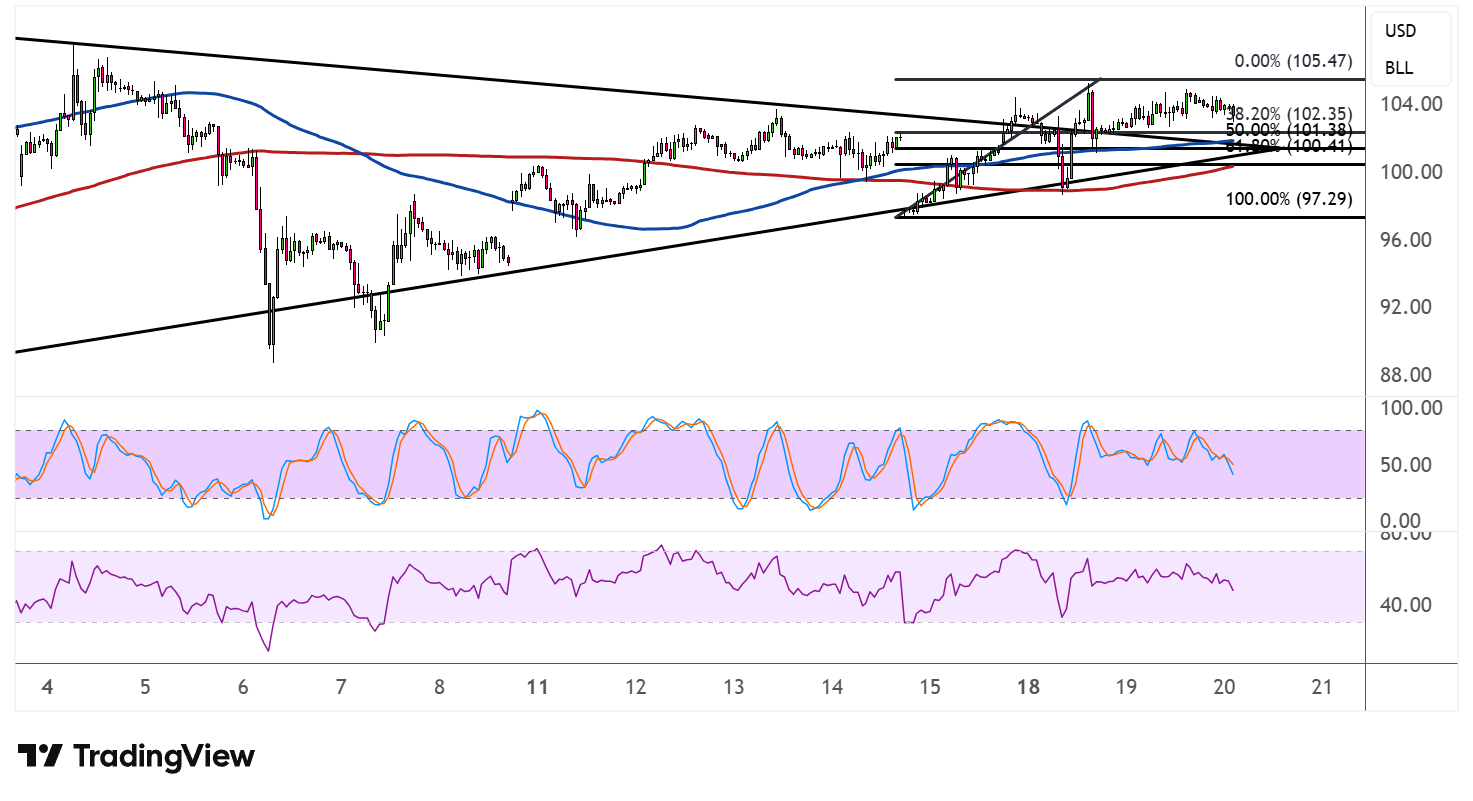
On the moving averages front, the 100 SMA has crossed above the 200 SMA, confirming that the path of least resistance is to the upside and that bulls have regained control of the broader trend. Price is trading above both indicators, which could serve as dynamic support on any dips back toward the Fib levels.
Stochastic is pulling back from the overbought zone, reflecting some near-term exhaustion among buyers. The oscillator has room to slide further before reaching oversold territory, which suggests the correction could have a bit more to go before buyers step back in.
RSI, meanwhile, is also trending lower from elevated levels, adding weight to the case for a short-term pullback. If any of the Fibonacci retracement levels manage to keep losses in check, however, WTI crude oil could resume its climb toward fresh highs above the $105.47 swing top.
The energy commodity continues to enjoy tailwinds from the prolonged closure of the Strait of Hormuz, as constrained global supply could continue to keep prices supported.