
The price of WTI Crude Oil extended current monthly gains to above $57.50 on Thursday in the process coming close to retesting August highs of $57.70. However, oil prices pulled back in the afternoon trading session to trade at about $56.20 just below yesterday’s highs.
The price of Light Crude Oil has been on a bullish run since Tuesday and this could continue on Friday if it can recover from Thursday’s later pullback. The pullback came after the WTI CRude Oil completed what appears like Elliot’s 1,2,3,4,5 Impulse wave.
WTI Crude Oil Fundamentals Overview

Oil is trading at the back of a calmer week in terms of geopolitical events, which explains the current bull-run. Trump appears to have cooled his fight with China on trade tariffs, at least on a relative basis compared to last month.
On Wednesday, the US API Weekly Crude Oil change for the week ended Aug 30 came in at 0.401M, a significant increase from the previous period’s change of -11.100M. But on Thursday, the EIA Crude Oil Stocks Change for the same period showed a decline of 4.771M barrels, which beat expectations of -2.488M.
Meanwhile, the Iranian foreign minister Zarif will officially inform the EU about Tehran’s decision to decrease its commitment to the 2015 nuclear deal. With Iran being one of the world’s largest oil-producing countries, this is bound to have a significant impact on oil prices in the coming months.
WTI Crude Oil Technical Analysis (the 60-min Chart)
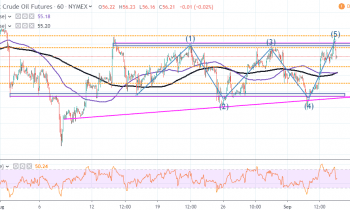
Technically, the price of Light Crude Oil appears to be trading in a sideways channel characterized by a series of pullbacks and rebound. Oil has recently bounced off the resistance zone at around $57.00 and is now on the way down towards the support at $53.70.
But before it can hit the bottom of that channel again, the bears will fancy themselves for opportunities at around $55.57 and $54.52. On the other hand, the bulls will hope for an immediate rebound towards, $56.78 or higher at $57.53.
WTI Crude Oil Technical Analysis (the Daily Chart)
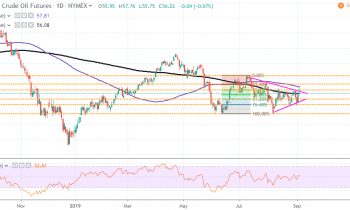
In the daily chart, the price of the WTI Crude oil appears to be trading in a consolidative triangular formation. This suggests that there could be a major break in the coming weeks.
Therefore, using the Fibonacci Retracements, the bulls will look to target profits at around 38.20% Fib level at $57.04 or high at 23.60% Fib level at $58.54. On the other hand, the bears will target profits at around $54.66 at 61.80% Fib level or lower at 76.40% Fib level at $53.20.
In summary, the price of the WTI Crude oil appears to be in a consolidative formation in the daily chart but in the short-term, the movement is stacked in a sideways channel, which could hold for the next few days.