
The WTI crude oil on Wednesday pulled back to trade at around $59.37 in a sideways channel formation. The price of light crude oil continues to trade within a larger descending channel formation in the 60-min chart.
It has now dropped below both the 100-hour and the 200-hour SMA lines. Wednesday’s pullback pushed the oil price closer to the overbought levels of the 14-hour RSI. This could trigger a short-term rebound going into the tail-end of the week.
WTI Crude Oil Fundamentals Overview

From a fundamental perspective, oil is trading ahead of a relatively significant period in the US market. The ISM Manufacturing PMI for March will be out on Thursday and this could signal where markets are at going into the new month. On Friday, the non-farm payrolls will provide a broader perspective of the US labor market following last month’s $1.9 trillion stimulus package. Eyes will also be set on the OPEC+ meeting which started on Wednesday to conclude on Thursday.
In the latest rig count data, the US API weekly crude oil stocks for the week ending March 25 came in at 3.91 million barrels up from 2.927 million reported the prior week. On the other hand, the EIA WTI crude oil stocks change report came in better than expected with a rig count of -0.876 million barrels compared to the expectation of 0.107 million barrels. This was also a significant reduction from the previous week’s 1.912 million.
WTI Crude Oil Technical Analysis (the 60-min Chart)
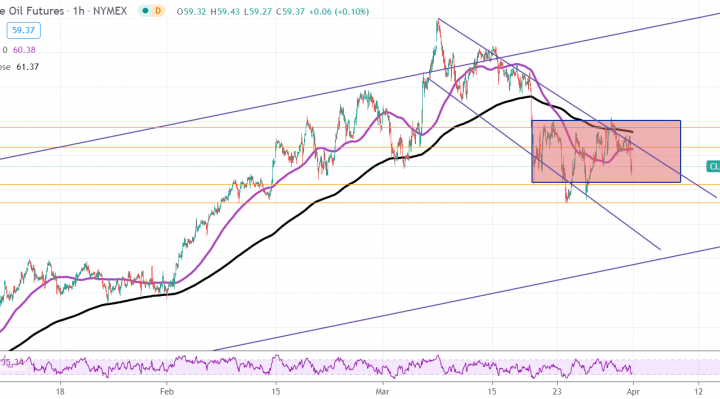
Technically, the price of WTI crude oil appears to be trading within a sideways channel formation. It is located within a larger descending channel formation. This suggests that the market remains inclined towards the bears despite an attempt by the bulls to reverse that.
The bulls will target short-term profits at around $60.50 or higher at $61.65. On the other hand, the bears will look to pounce for short-term pullbacks at around $58.34 or lower at $57.24.
WTI Crude Oil Technical Analysis (the Daily Chart)
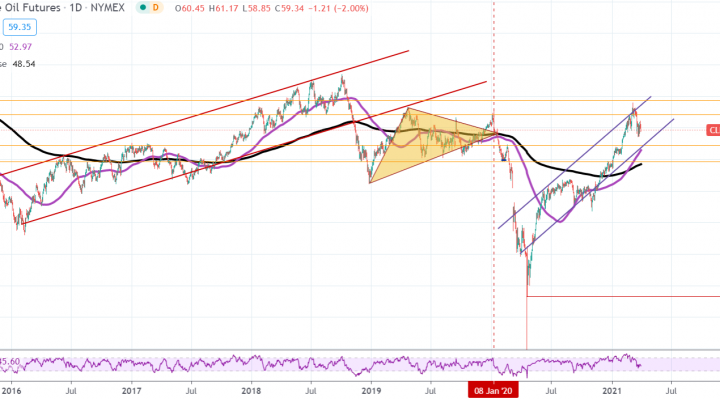
In the daily chart, the price of light crude oil appears to be trading within an ascending channel formation. This indicates a significant long-term bullish bias in the market sentiment. It has recently pulled back closer to the oversold levels of the 14-day RSI.
The bears will target long-term pullback profits at around $54.57 or lower at $49.21. On the other hand, the bulls will look to retain long-term control by targeting profits at around $64.14 or higher at $68.64.