
Oil prices on Thursday pulled back off new 4-week highs of about $27.25 to trade at around $23.39 per barrel amid excessive supply. Oil prices continue to trade within an ascending wedge slightly above the 100-hour and the 200-hour SMA lines in the 60-min chart.
The WTI Crude Oil has since pulled back off overbought levels of the 14-hour RSI. It now appears to be heading towards the border to the oversold levels, which could trigger the next rebound. The price of oil is currently pinned just above the 100hour SMA and is currently hugging the trendline support.
WTI Crude Oil Prices Fundamentals Overview

From a fundamental perspective, oil prices continue to suffer from the ongoing wrangles between the US and Saudi Arabia. So far, the biggest issue has been an oversupply of the valued commodity. However, talks are ongoing for potential output cuts in the coming months. This could be the reason behind the recent rally in the price of WTI Crude Oil.
Furthermore, the coronavirus pandemic has affected the global demand for oil amid a reduced activity in international travel. The prospected squeeze in global growth will also affect future demand.
In the latest US API Weekly Crude Oil Stocks, 8.44M barrels for the week ended May 1 down from 9.978M in the previous week. And on Wednesday, the EIA Crude Oil Stocks change came in positive with a change of 4.59M versus a predicted change of 7.759M down from the previous week’s change of 8.991M.
WTI Crude Oil Price Technical Analysis (the 60-min Chart)
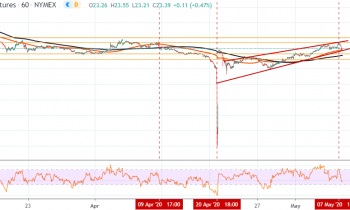
Technically, the price of light crude oil appears to be trading ina slightly ascending wedge in the 60-min chart. This indicates a short-term bullish bias in the market sentiment. The oil price also enjoys a strong trendline and MA support. This could trigger a rebound.
The bulls will be targeting short-term rebound profits at around $27.25 or higher at $30.47. On the other hand, the bears will look to extend the pullback towards $19.78 or lower at $16.35.
WTI Crude Oil Technical Analysis (the Daily Chart)
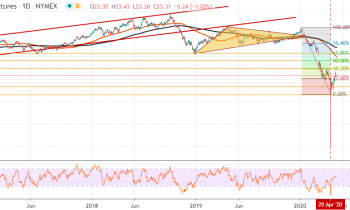
In the daily chart, the WTI crude oil appears to be on a recovery trail following a massive plunge between January and April this year. It has now surged nearly 30% following the recovery.
The bulls will be targeting long-term profits at 38.20%, 50%, and 61.80% Fib levels at $29.65, $36.45, and $43.03, respectively. On the other hand, the bears will look to pounce at around $13.01 or at 0.00% Fib level at $5.99.