
The light crude oil price on Friday pulled back to trade below $68 per barrel before bouncing back later to settle at $68.04. The WTI crude oil continues to trade within a gently ascending channel formation in the 60-min chart.
The oil price has now dropped to trade below the 100-hour moving average following Friday’s pullback. It has also plummeted closer to the oversold conditions of the 14-hour RSI.
WTI Crude Oil Fundamentals Overview

From a fundamental perspective, the oil price is trading at the back of a relatively busy period in the market. On Friday, the International Energy Agency (EIA) warned about a potential slowdown in demand for crude oil amid the covid-19 situation. EIA said demand fell by 120,000 barrels per day last month, and now expects it to be down 500,000 barrels PD, from its June forecast.
The price of light crude oil is also experiencing pressure after the EIA weekly crude oil stocks change for last week came in higher than expected at -0.447 million barrels compared to the estimate of -1.271 million barrels. Earlier in the week, the US API Weekly Crude oil stock came in at -0.816 million down from the previous week’s equivalent of -0.879 million.
Investors will be looking forward to upcoming reports to see how the inventory count trends.
WTI Crude Oil Technical Analysis (the 60-min Chart)
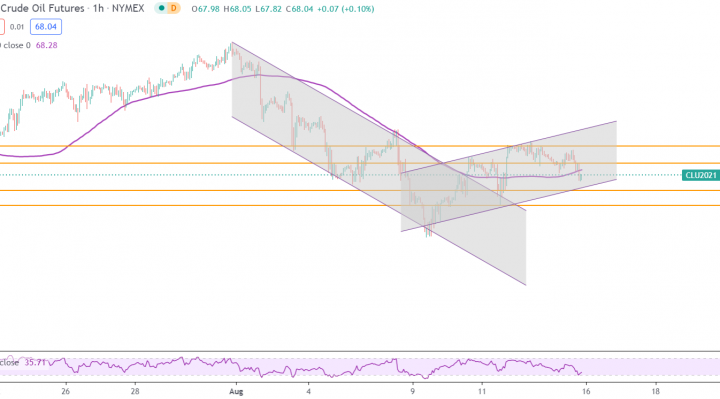
Technically, the light crude oil price appears to be trading within a gently ascending channel formation in the 60-min chart. The oil price recently pulled back to trade closer to the oversold conditions of the 14-hour RSI. It has also fallen below the 100-hour moving average.
Therefore, the bulls will be targeting potential rebound profits at approximately $68.60 or higher at $69.40. On the other hand, the bears will look to pounce on extended pullbacks at approximately $67.30 or lower at $66.63.
WTI Crude Oil Technical Analysis (the Daily Chart)
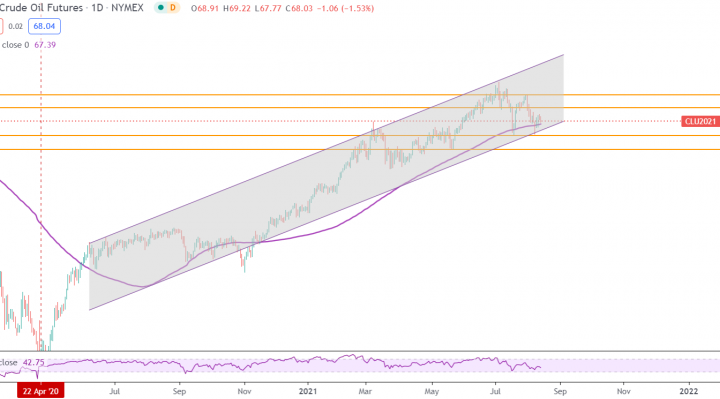
In the daily chart, the WTI crude oil price seems to be trading within an ascending channel formation. It has recently pulled back to find support from the 100-day moving average. This indicates a long-term bullish bias in the market sentiment.
Therefore, the bulls will be looking to extend long-term gains towards $71.07 or higher to $74.02. On the other hand, the bears will look to pounce for profits at approximately $64.76 or lower at $61.61.