
The WTI Crude Oil pulled back on Wednesday as the market prepared for the release of the Environmental Impact Assessment (EIA) report which assesses the effects of various activities on the earth including socio-economic effects, cultural and human-health. The price of WTI Crude Oil dropped from above $60.00 to trade around the $59.50 by mid-day as it drifted towards the $59.00 level.
WTI Crude Oil Fundamentals Overview
From a fundamental perspective, the EIA report can affect crude oil prices mildly, but traders are likely to remain upbeat irrespective of the sentiment of the report. Nonetheless, WTI Crude oil traders will be more interested in yesterday’s API Weekly Crude Oil stock report which stood at 1.927 for last week.

The Weekly Statistical Bulletin (WSB) reports “total U.S. and regional data relating to refinery operations and the production of the four major petroleum products: motor gasoline, kerosene jet fuel, distillate (by sulfur content), and residual fuel oil,” which basically represent around 85% of the total petroleum industry.
WTI Crude Oil Technical Analysis (the 240-min Chart)
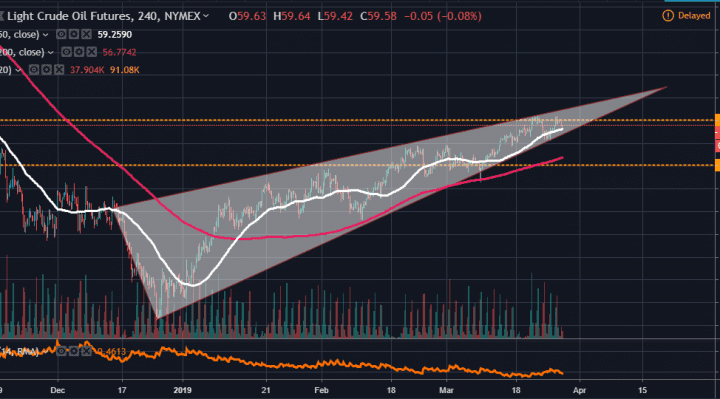
Technically the price of oil has been trading within an ascending wedge, which appears to be forming a symmetrical triangle. This could lead to a breakout soon, which will be indicative of a major change in market sentiment towards WTI Crude Oil prices.
Nonetheless, the bulls will be looking to target profit opportunities at around $60.10 level, while the bears will hope that the current pullback continues towards the $59.00 level, or even further down below.
WTI Crude Oil Technical Analysis (the Daily Chart)
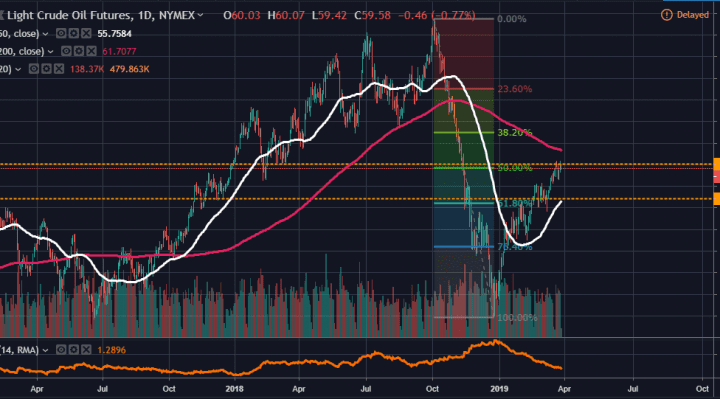
In the daily chart, the price of oil appears to be on a long journey of recovery after the October-December plunge that saw the WTI Crude Oil price fall from about $77 per barrel to trade at just $42.50 in under three months.
We are barely 50% in that recovery journey. The current price of $59.50 coincides with the 50% Fib level as demonstrated while the 50-day and the 200-day SMA lines act as the distance support and resistance levels. These will provide valuable profit targets for both the bulls and the bears going into April.
In summary, the WTI Crude Oil appears to be on a rebound following last year’s plunge. However, it looks like the 50% Fib level is providing crucial resistance with the price of oil finding it difficult to advance further. The next few days will be interesting as the month comes to a close.