
The price of the WTI crude oil on Friday pulled off 7-month highs to trade at around $62.99 despite a positive EIA report. The price of oil had earlier in the day rallied to top $64.11 amid reports about a potential war erupting in the Gulf region of the middle east.
The oil price has now pulled off overbought levels of the RSI indicator in the 60-min chart but the bulls retain control and could soon rally back above $63 in the coming days.
WTI Crude Oil Fundamentals Overview

From a fundamental perspective, the price of oil is trading at the back of reports that war in the middle east could disrupt prices by limiting supply. This has contributed to the sharp the oil price early on Friday but the market appears to have calmed down towards the close of day prompting a pullback in the price of light crude oil.
On Tuesday, the US API WTU Crude oil stocks edged lower to -7.8M versus the previous week’s balance of -7.9M. And on Friday, the EIA Crude Oil Stocks Change report showed a change of -11.463M compared to the consensus estimate of -3.288M. In the previous week, the EIA report showed a change of -5.474M. The EIA Natural Gas Storage also beat the expectation of -57B with -58B but was till less impressive from the previous week’s balance of -161B.
Overall, the US-Iran geopolitical tensions continue to dictate the movement of oil prices and if this continues we could witness a significant rise in the price of the WTI Crude oil in the coming days.
WTI Crude Oil Technical Analysis (the 60-min Chart)
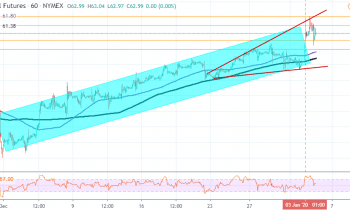
Technically, the price of oil appears to be trading in an ascending channel, which indicates a significant bullish pressure in the market sentiment. The oil price made a sharp climb on Friday amid escalating US-Iran tensions, and this appears to have handed the bulls more control in the short-term market.
Therefore, the bulls will target short-term profits at around $63.51 or higher at $64.11 going into next week. On the other hand, the bulls will hope for an extension of the pullback towards $62.55 or lower at $61.97.
WTI Crude Oil Technical Analysis (the Daily Chart)
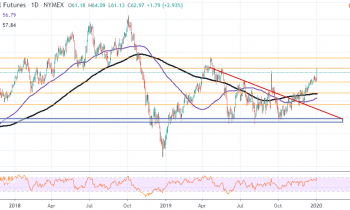
In the daily chart, the light crude oil appears to be experiencing a bullish bias in the market sentiment following the October 2019 rebound. The oi price has maintained a bullish run since then and this seems set to continue through the early parts of this year.
Therefore, the bulls will be targeting long-term profits at around $64.11 or higher at $66.55. On the other hand, the bears will hope for a major pullback in the oil price towards $60.65, $57.59 or lower at $55.25.