
The price of gold (XAU/USD) rallied to new multi-year highs on Friday to trade above $1,400 for the first time since 2013. The yellow metal has enjoyed a stellar week rallying from a low of $1,334 on Monday to end the week with a new multi-year high of about $1,412.
The Yellow metal had pulled back slightly between March and May this year but has since obliterated those losses by advancing to trade above $1,400. But on a broader view, the price of gold remains relatively bullish since last year, albeit with a few pullbacks.
XAU/USD (Gold) Fundamentals Overview

From a fundamental perspective, the price of gold continues to trade at the back of a dovish Fed statement that all-but confirmed that there could be a rate cut sometime this year. This came following concerns about recent economic data and trade tensions between the US and China.
Last month’s Jobs data missed expectations with just 75,000 new jobs created compared to 185,000 expected while wage growth slowed on a year-over-year basis. Furthermore, President Trump has recently hinted that the US could start another trade war with its close neighbor Mexico.
XAU/USD Technical Analysis (the Daily Chart)
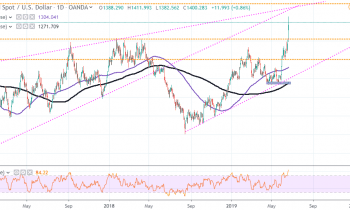
The price of gold climbed sharply on Thursday and Friday as concerns over the US economy continued to grow. After bouncing off the key support zone last week, this week has been all about gainst. This propelled the price of the yellow metal well above $1,400 thereby creating new profits targets for traders.
Going into next week, the bulls will be more optimistic and they will target profits at around $1,440 while the bears will hope for an unlikely pullback towards $1,364. The bears will look at the Relative Strength Index indicator and hope that the overbought trading zone triggers a pullback.
XAU/USD Technical Analysis (the Weekly Chart)
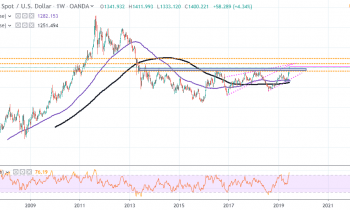
In the weekly chart, the price of gold appears to have broken through a key resistance zone around $1,400 level, which dates back to 2013. This suggests that traders could now begin to target trading profits above these levels unless a major pullback occurs.
As such, the bulls will look at $1,490 for long-term profits and will be more optimistic while the bears will hope for a major reversal towards $1,320. The weekly chart also shows that the price of gold has reached overbought levels as per the RSI Indicator, which again will give the bears hope.
In summary, the price of the gold (XAU/USD) looks to enjoy a short-term bullish bias after breaching the key resistance at $1,400. However, the RSI suggests that a pullback could well be on the cards.