
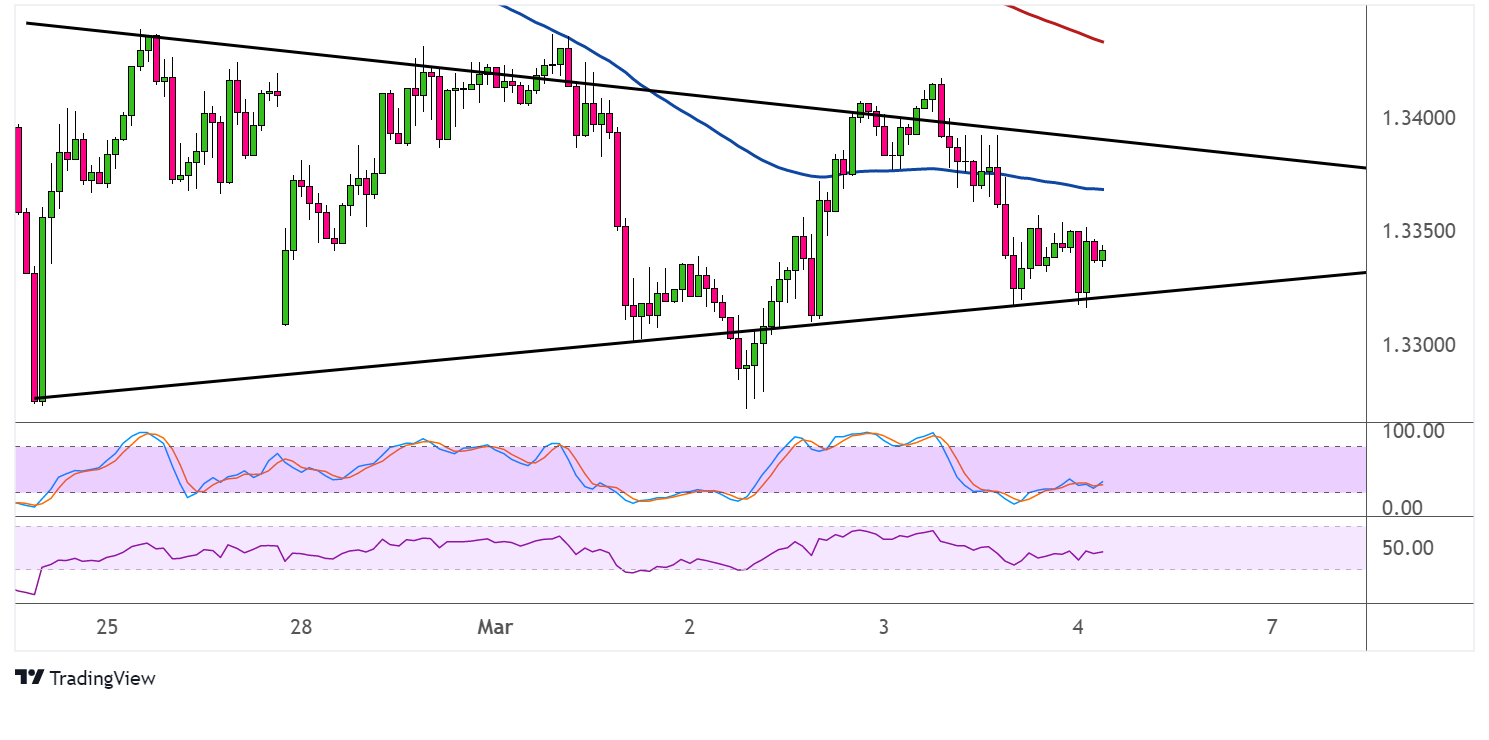
GBPUSD formed lower highs and higher lows inside a symmetrical triangle on its short-term time frame, with price currently testing the bottom. A bounce could take it back up to the triangle top at 1.3400.
Stochastic is already indicating oversold conditions or exhaustion among sellers, and the oscillator is pulling higher to suggest a pickup in bullish pressure. RSI is also gradually edging higher to show that buyers have the upper hand.

However, the 100 SMA is below the 200 SMA to indicate that the path of least resistance is to the downside or that support is more likely to break than to hold. If that happens, GBPUSD could be in for a slide that’s the same height as the chart pattern or around 200 pips.
The pair is also below both moving averages, so these could hold as dynamic resistance on pops higher. Then again, the gap between the indicators is narrowing to reflect weakening selling pressure.
GBPUSD could take cues from the US NFP release later today, as the economy might print a slightly slower pace of hiring gains. Analysts are pricing in a 407K gain versus the earlier 467K increase, but most leading indicators are pointing to stronger results.
Both the ADP non-farm employment change report and the ISM manufacturing PMI beat expectations, suggesting that an upside NFP surprise might be in the cards. The ADP reading came in at 475K versus the 378K estimate for February while the previous reading was upgraded to 507K.
However, the ISM services PMI fell short of estimates to show a slower pace of growth in the industry. Its jobs component fell from 52.3 to 48.5 to reflect contraction, as employers struggled to fill vacancies and dealt with more employee turnover in the past month.
Weaker than expected NFP data might dash hopes for a Fed rate hike soon, possibly forcing the dollar to return some gains.