
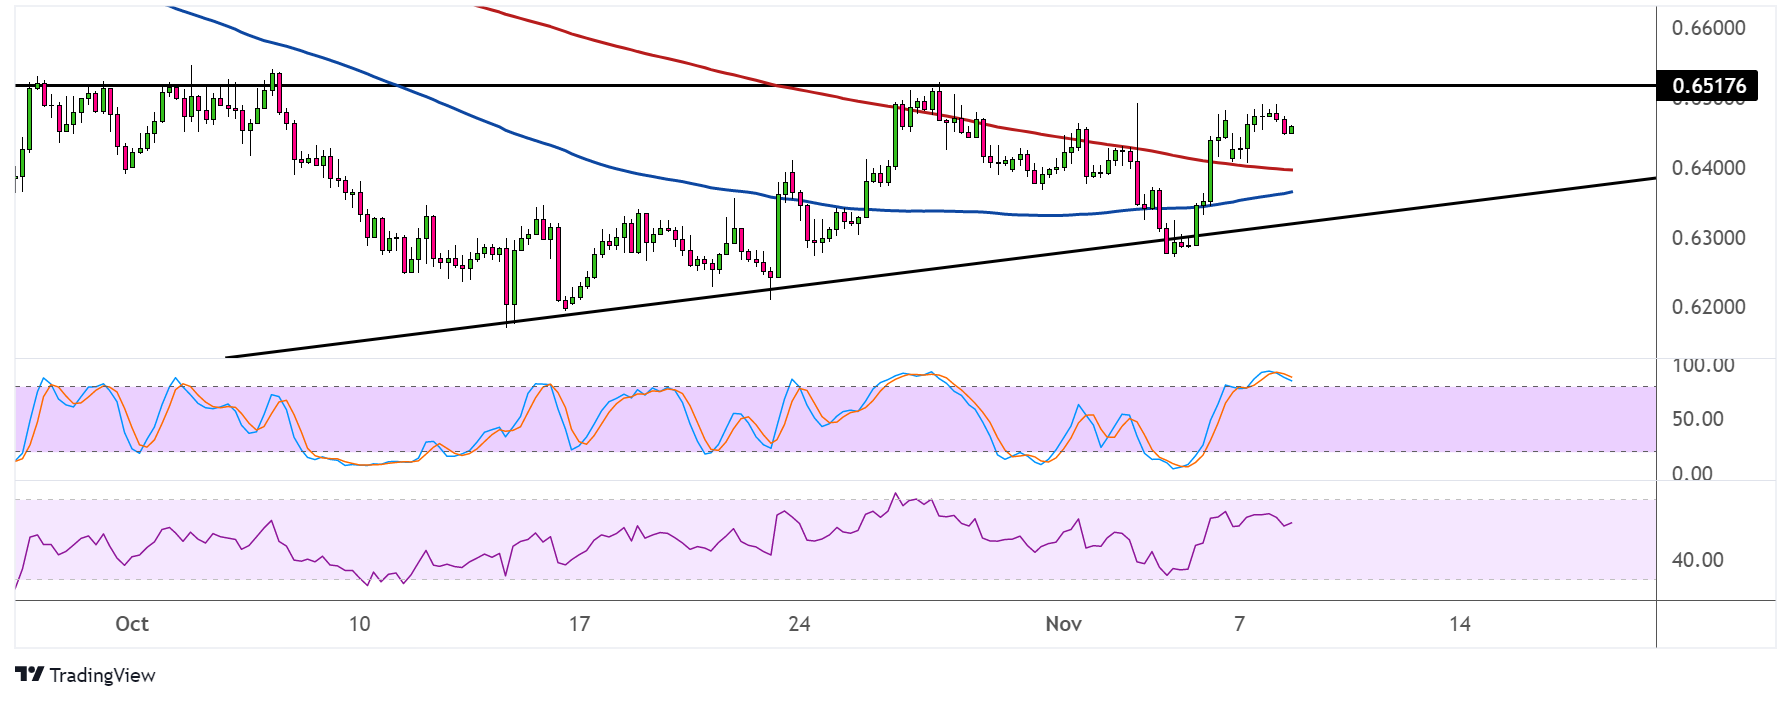
AUDUSD has formed higher lows and found resistance around the .6500 major psychological mark, creating an ascending triangle on its short-term time frames. Price is moving closer to testing the top of the triangle, which might keep gains in check once more.
The 100 SMA is still below the 200 SMA to indicate that the path of least resistance is to the downside or that the ceiling is more likely to hold than to break. However, AUDUSD has already climbed above both moving averages and the gap between the indicators is narrowing to reflect slowing bearish pressure.

If bulls take over, AUDUSD could break above the triangle top and go for a rally that’s the same height as the chart formation or around 300 pips.
However, stochastic is already indicating overbought conditions or exhaustion among buyers, so turning lower would mean that sellers are taking over. RSI has a bit more room to move higher before reaching the overbought area, but the oscillator already seems to be topping out.
AUDUSD could take cues from the CPI reports to be released by China and the US later this week. Both economies are expected to report slowdowns in price pressures.
Stronger than expected data from the US might mean more upside for the dollar, though, as this might revive expectations for a 0.75% interest rate hike from the Fed. On the other hand, downside surprises could convince market watchers that a pivot to smaller rate hikes is more likely.
In China, the headline CPI is slated to slow from 2.8% to 2.4% while the producer price index might post a 1.6% slump, signaling weaker price pressures down the line. Stronger than expected data, however, could bring some upside for the correlated Australian dollar.
Apart from that, risk sentiment would likely push the higher-yielding commodity currency around later in the week.