
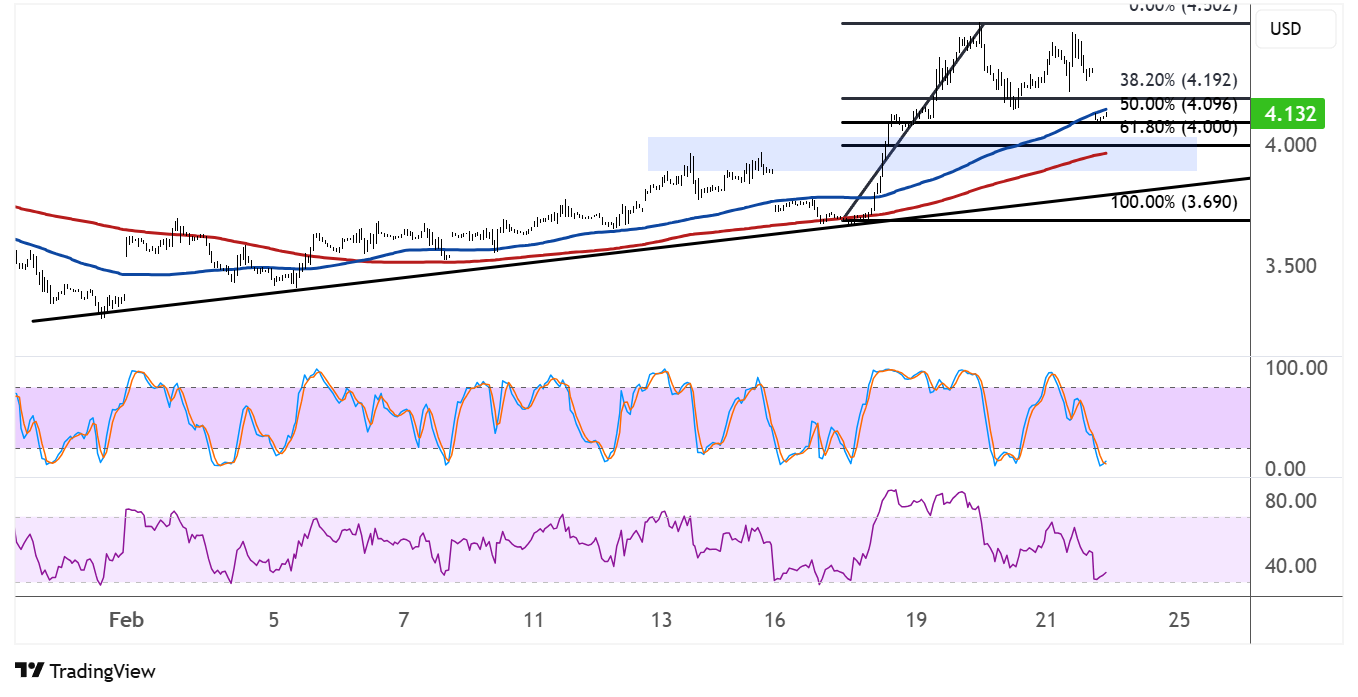
Natural gas continues to trend higher but has gapped down over the weekend, dragging price down to the correction levels marked by the Fibonacci retracement tool.
Price is testing the 50% Fib at $4.096 near the 100 SMA dynamic inflection point. A bounce off this level could lead to a move back to the swing high at $4.302 or higher. A larger correction could still test the 61.8% Fib at $4.000, which is also near an area of interest and a rising trend line, as well as the 200 SMA.

The 100 SMA is above the 200 SMA to confirm that the path of least resistance is to the upside or that support levels are more likely to hold than to break. The gap between the indicators is even widening to reflect strengthening bullish momentum.
A break below the support area around $4.000, on the other hand, could set off a reversal from the uptrend. Stochastic is heading down but already dipping into the oversold region to reflect exhaustion among sellers, so turning higher would mean a pickup in bullish pressure.
RSI has a bit of room to slide before reaching the oversold area to reflect exhaustion among sellers, but the oscillator also seems to be moving up to suggest that buyers are eager to take over.
Natural gas gapped down over the weekend on forecasts of warmer weather conditions, likely sapping consumption of heating commodities in the coming days. This could mean a build in stockpiles as reported by the Department of Energy, possibly resulting to even more price declines.
Still, indicators that demand remains supported could lead to a rebound in natural gas prices, especially if export activity picks up and and weighs on local inventories. A surprise reduction in stockpiles could mean a continuation of the natural gas rally.