
EURCAD has formed a head and shoulders reversal pattern on its 4-hour chart, signaling that a shift from the previous uptrend could be in the cards. The pair has carved out a clear formation with the left shoulder around 1.6200, the head near 1.6400, and the right shoulder also around 1.6200.
Price is currently testing the neckline support around the 1.6200 major psychological level, and a decisive break below this level could confirm the reversal pattern. Based on the formation’s height, a measured move lower could take EURCAD down toward the 1.6000 handle or even further.

The horizontal support zone highlighted on the chart spans from 1.6180 to 1.6220, representing a critical area where buyers might attempt to defend. However, sustained trading below this zone would likely trigger additional selling pressure and open the door for a more substantial decline.
On the flip side, a strong bounce off current support could invalidate the bearish pattern and allow the pair to consolidate further near recent highs.
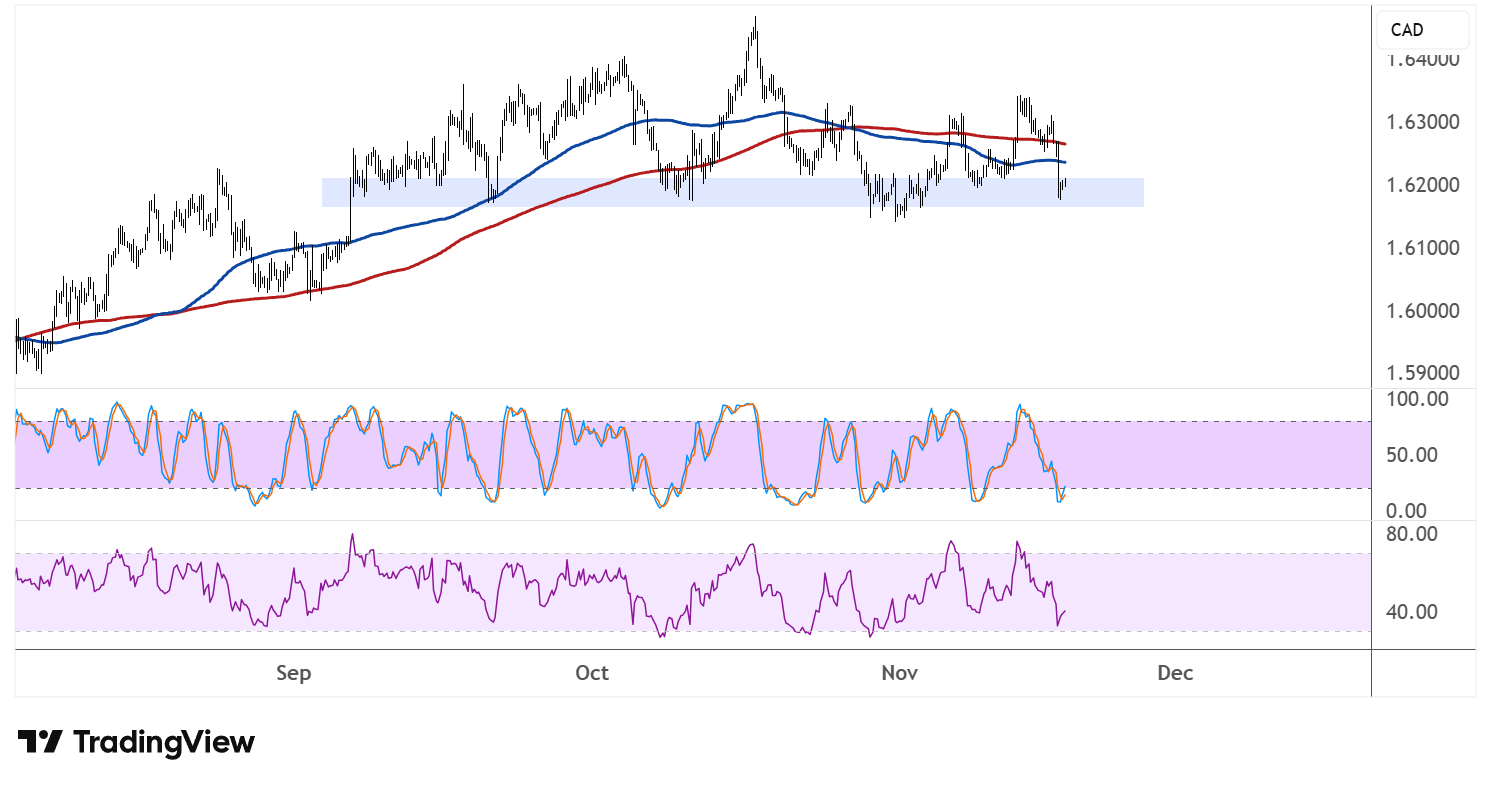
Looking at the moving averages, the 100 SMA has crossed below the 200 SMA to signal that the path of least resistance is now to the downside. Price is also trading below both dynamic indicators, suggesting that these could act as resistance on any near-term bounces.
The stochastic oscillator is heading south from the overbought region, reflecting a return in selling momentum. The indicator still has considerable room to decline before reaching oversold territory, which means that bearish pressure could persist in the sessions ahead.
RSI has also turned lower and is hovering around the midpoint, indicating that sellers are starting to take control. A break below the 50 level would reinforce the bearish outlook and suggest that the downtrend has more room to run.
EURCAD could take cues from economic data, particularly the flash PMI releases from the euro region on Friday as the numbers would provide an early glimpse into business activity for the current month.