
EURJPY is at a critical juncture, as the pair has been carving out a symmetrical triangle pattern on its short-term chart since late January, with price now pressing against the upper boundary of the formation.
The ongoing test of this descending resistance line around the 183.20 level will likely determine whether bulls can stage a breakout or whether sellers reassert control and push the pair back toward triangle support.

The converging trend lines have been steadily squeezing price action, with lower highs and higher lows compressing momentum ahead of what could be a significant directional move.
If buyers manage to push a clean close above the triangle’s upper boundary, EURJPY could target the swing highs near the 185.00–186.00 region. A rejection from current levels, however, could send the pair sliding back toward the rising lower trend line, now sitting closer to the 182.00 area, with a break below opening the door to the 181.00 lows.
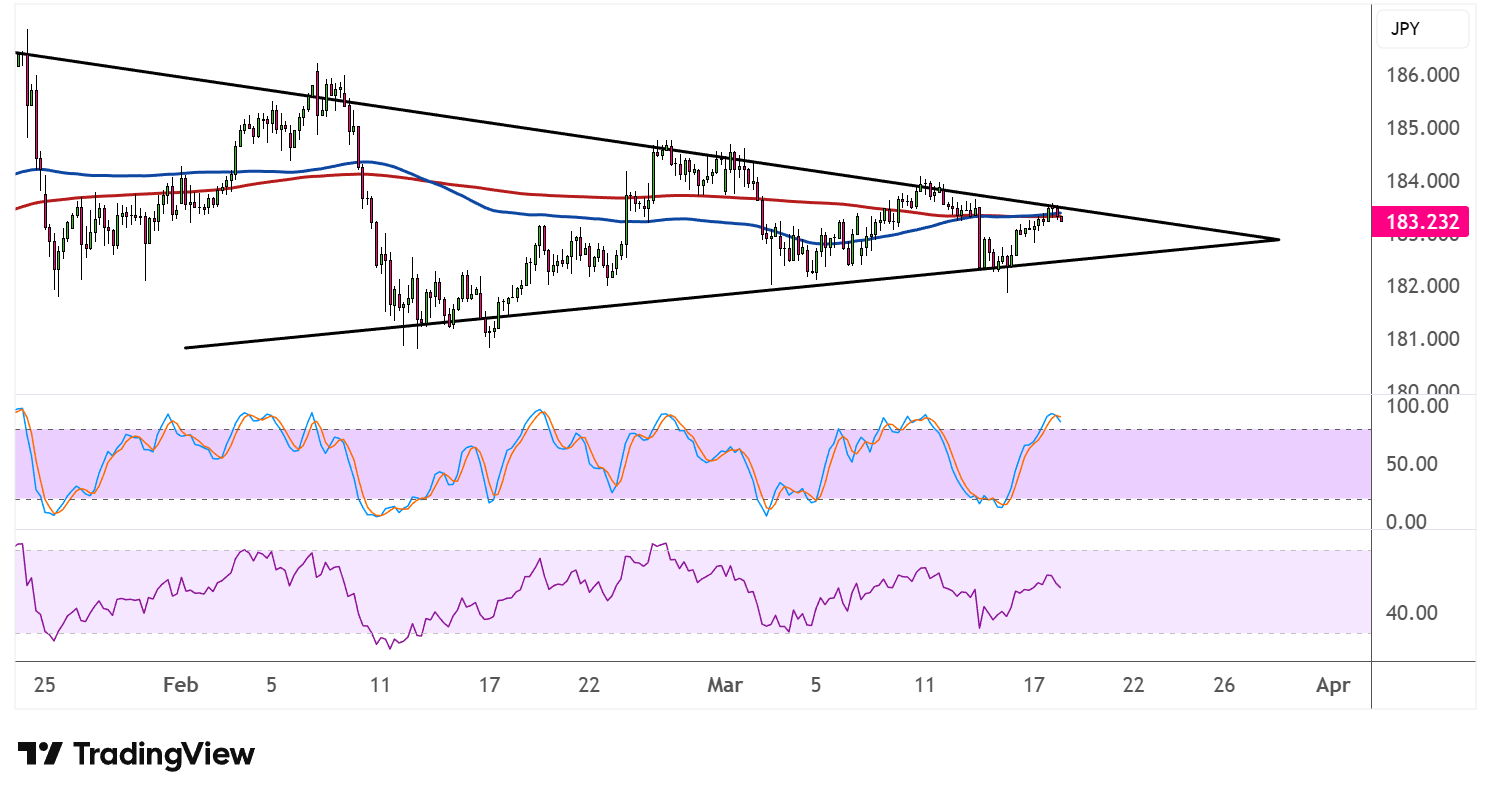
On the moving averages front, the 100 SMA has crossed below the 200 SMA, suggesting that the path of least resistance remains to the downside. Both indicators are hovering around the 183.00–184.00 zone and could act as dynamic resistance, adding another layer of selling pressure should the breakout attempt stall.
Stochastic has surged back into overbought territory following the recent bounce off triangle support, reflecting strengthening bullish momentum in the near term. However, the oscillator’s proximity to the upper extreme suggests that buying pressure could begin fading soon, potentially tipping the scales back in favor of sellers.
RSI, meanwhile, has climbed back toward the 60 level and is trending higher, giving bulls a slight edge for now. A turn lower from here, though, could confirm that the resistance test has failed and that a pullback is in order.
EURJPY could take cues from the central bank decision of the ECB and BOJ later in the week, as a more hawkish or dovish tilt from either could spur a directional move.