
The USD/CAD currency pair yesterday afternoon rallied more than 30 pips to close the session at about 1.2810 after trading within a short range of about 1.2750 to 1.2770 in the morning hours. The Canadian Dollar was momentarily boosted by strong Canada Wholesale sales released May 22, at 8:30 a.m. Canada’s wholesale sales increased by 1.1% compared to the 0.4% decline reported on April 23. The figure also beat analyst expectations of 0.8% thereby triggering the Loonie resurgence.
However, what appeared to be a potential edge against the USD was quickly overshadowed roughly two hours later when the U.S. Richmond Manufacturing Index numbers were announced. Last month, the U.S. Richmond Manufacturing Index announced a decline of 3 basis points but on May 22, the data was positive with 16 basis points gain. This also trumped analyst estimates of 9 basis points thereby triggering what turned out to be a major response by the USD for the rest of the afternoon.

And on Wednesday May 23, the FOMC committee will publish the minutes (in detail) from the previous meeting, which could provide the USD with another edge against the CAD. This could push the USD/CAD currency pair further up by the end of the week, which supports a short-term bullish bias.
This theory is also supported technically as suggested by the hourly (60 min) chart below. As such, this creates a few trading opportunities for both the bulls and the bears.

The hourly chart seems to suggest that the USD/CAD currency pair may be on course to completing the fifth wave in Elliot’s Impulse wave (1,2,3,5,5) as illustrated above. The wave seems to have formed a key support zone at around the 1.2750 to 1.2760 zone while the resistance zone seems firmly fixed at the 1.2900 to 1.2920 trading zone.
However, in between these zones, there are a few consolidation levels that traders can target for profits in the short term.
For the bulls, opportunities can be found at (R1) (1.2836 to 1.2840), (R2) (1.2860 to 1.2870), and (R3) (1.2880 to 1.2890). However, should the USD/CAD currency pair defy the odds and push downwards against the current momentum, then the bears will be looking to pounce for profits by targeting (S1) 1.2800, (S2) 1.2780, and (S3) 1.2760.
These opportunities may not result in massive profits given they are only a few pips apart. However, traders can also look for opportunities for the intermediate trading period, which could result in higher returns.
The 4-hourly chart paints a clearer picture in this perspective.
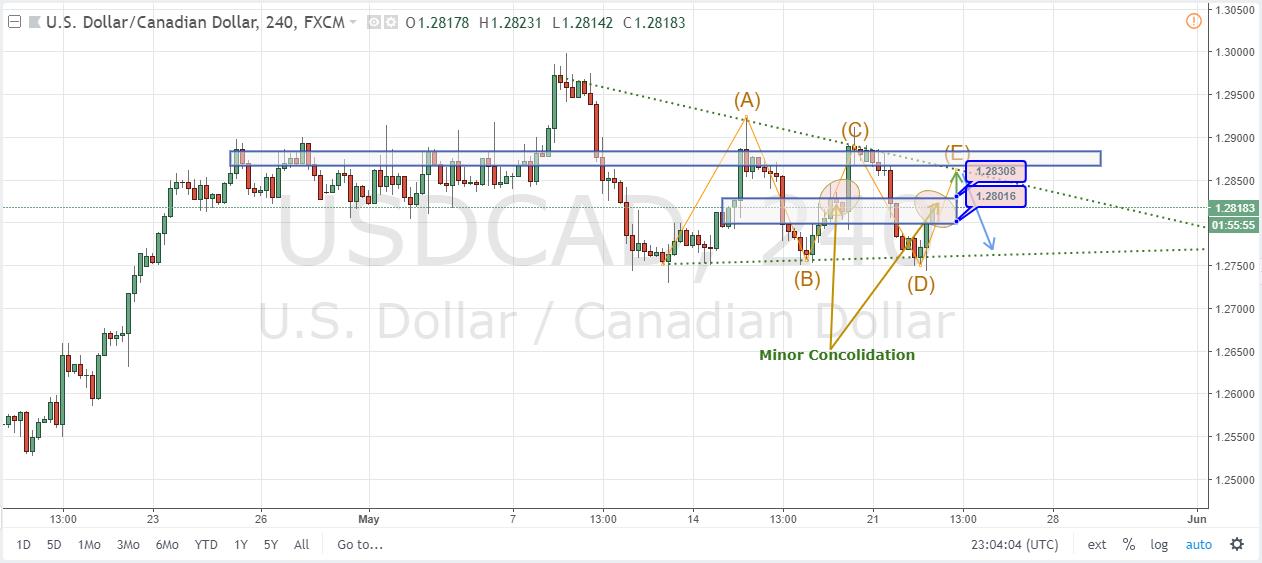
When you look at the 4-hourly chart above, it looks like the USD/CAD currency pair is currently forming what appears to be a converging triangle with a flat base and an inclined top. Theoretically, this is a bearish triangle, which means that at some point soon, there could be a downward breakout.
However, before that happens, the seesaw movement within the triangle could continue potentially through early next week. This means that trading opportunities can be found by identifying the potential rebound zones as the pair continues to swing sideways.
The 4-hourly chart seems to suggest that the next major rebound/pullback for the pair could occur at around the 1.2850 to 1.2860 level. This will be a bullish opportunity for traders resulting in about 40 pips worth of profits given the current trading range of about 1.2810 to 1.2820.
However, if the pair rejects this move and instead plummets, then the bears will be quick to act on opportunities with a target range of 1.2770 to 1.2750 due south resulting in about 40 pips to 50 pips worth of profits.
Nonetheless, the pair might yet consolidate momentarily at around the 1.2810 to 1.2820 trading zone as indicated in the chart before significantly edging out in one direction or the other.
In summary, the USD/CAD currency pair is currently edging higher after Tuesday’s rebound following strong Richmond Manufacturing Index data which strengthened the USD. Furthermore, the FOMC releases minutes for the May meeting on Wednesday May 22, and this could provide the pair with more upward momentum for the rest of the week. Essentially, traders could be looking for bullish opportunities in the short-term, but a major pullback can be expected perhaps later next week if the theory presented by the 4-hourly chart holds.