
USDCAD formed lower highs and found support around 1.3130 to create a descending triangle on its 1-hour time frame. Price is approaching the peak of the pattern so a breakout could be due anytime soon.
But which direction will it go? While the breakout move could likely take its cue from the catalysts lined up from both the US and Canada today, it’s worth looking at the technicals first.

The 100 SMA is safely below the longer-term 200 SMA to hint that the path of least resistance is to the downside. This basically means that a break of support is more likely to happen than a rally past the resistance at 1.3150. The top of the triangle also lines up with the 100 SMA dynamic inflection point, which adds to its strength as resistance.
The gap between the moving average is also widening to reflect stronger selling pressure. Note that the chart pattern is around 100 pips in height so the resulting breakout could last by at least the same number of pips. However, a move higher could also hit resistance at the 200 SMA dynamic inflection point first.
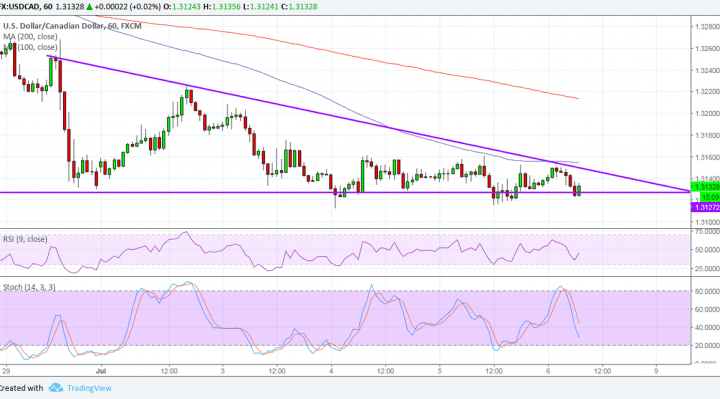
RSI is pointing up without even hitting oversold conditions, which means that buyers are eager to return. Stochastic, on the other hand, is pointing south so USDCAD could follow suit while sellers have the upper hand. When this oscillator hits oversold levels and turns back up, though, buyers could regain control.
The US NFP report is due today and this usually spurs a lot of volatility for dollar pairs. Analysts are already expecting a slightly weaker read compared to the earlier month, so any upside surprise could be accompanied by a pronounced rally. A very disappointing read might spur a sharp selloff just as well.
Canada is also set to print its jobs report and this would likely set expectations for the BOC decision this month. Poloz has dropped some cautious remarks but markets continue to price in a hike at some point.