
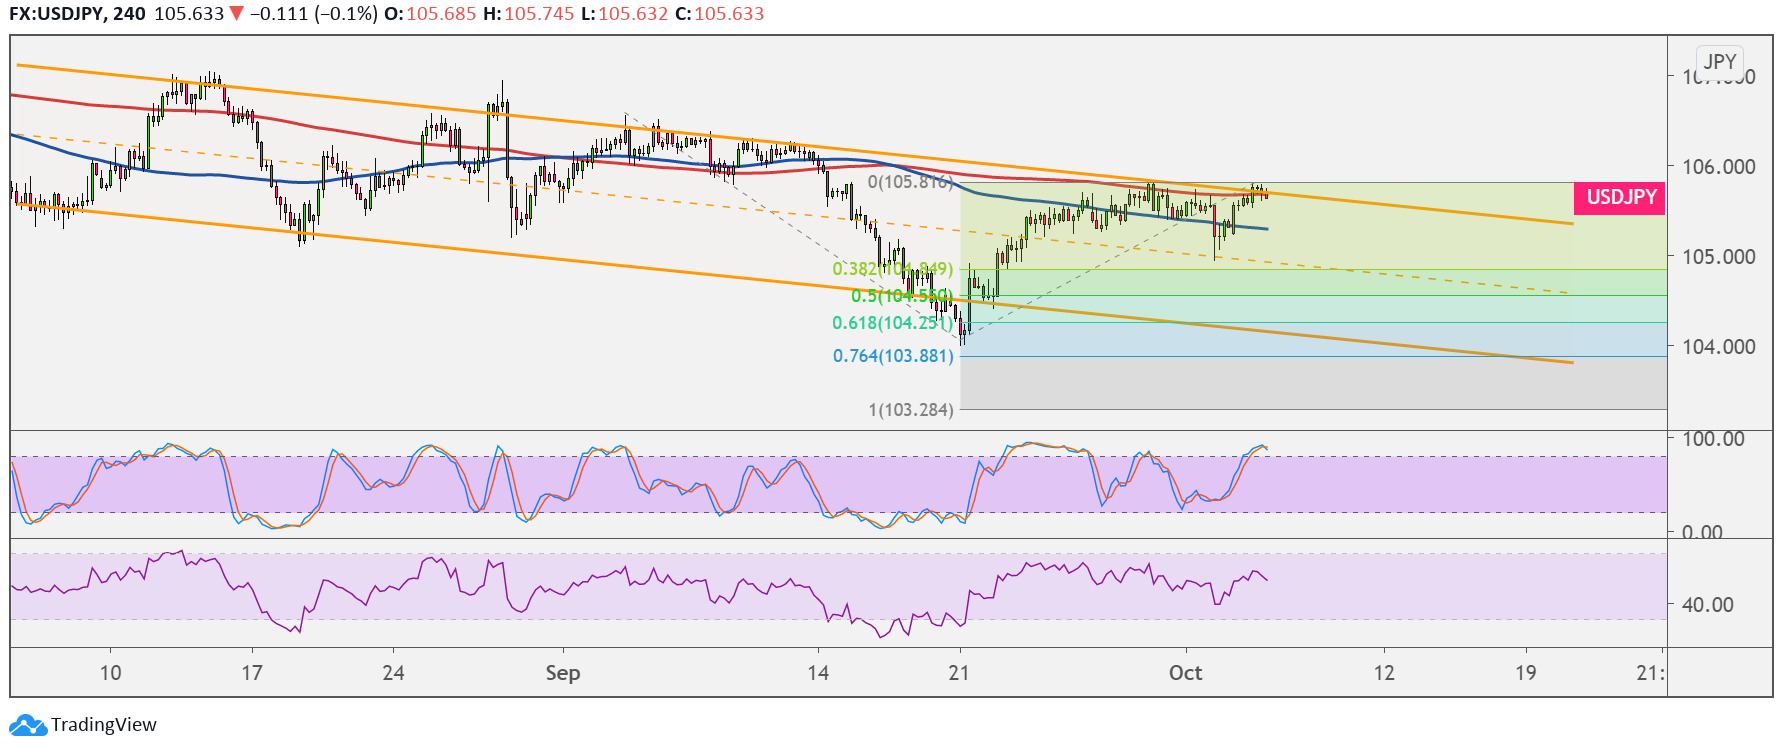
USDJPY is trending lower inside a falling channel with its lower highs and lower lows on the 4-hour chart. Price is currently testing the channel resistance, still deciding whether to bounce or to break higher.
If the resistance holds, USDJPY could resume the drop to the downside targets marked by the Fibonacci extension tool. The 38.2% level is in line with the mid-channel area of interest at 105.00 then the 61.8% level is close to the swing low at 104.25. Stronger selling pressure could take the pair down to the 76.4% level at the channel bottom or the full extension at 103.28.

The 100 SMA is below the 200 SMA to confirm that the path of least resistance is to the downside or that the selloff is more likely to resume than to reverse. A break past the 200 SMA dynamic inflection point at the channel top, however, could be followed by an uptrend.
Stochastic is already indicating overbought conditions or exhaustion among buyers. Turning lower could show that sellers are taking over and could keep the downtrend intact. RSI is already moving south without hitting overbought levels, suggesting that sellers are eager to return.
The US dollar appears to be drawing support from hopes of another round of stimulus from the central bank and government, along with optimism about Trump’s recovery after testing positive for COVID-19.
Fed head Powell has a speech coming up and the FOMC minutes are up for release later in the week, so it could be a volatile one for the US currency. Meanwhile, there are no major reports lined up from Japan, so the yen could take cues from overall market sentiment.
If the previous week is any indication, the lower-yielding Japanese currency could keep losing ground if traders are in the mood for riskier holdings. A return in risk-off flows could be bullish for the yen.