
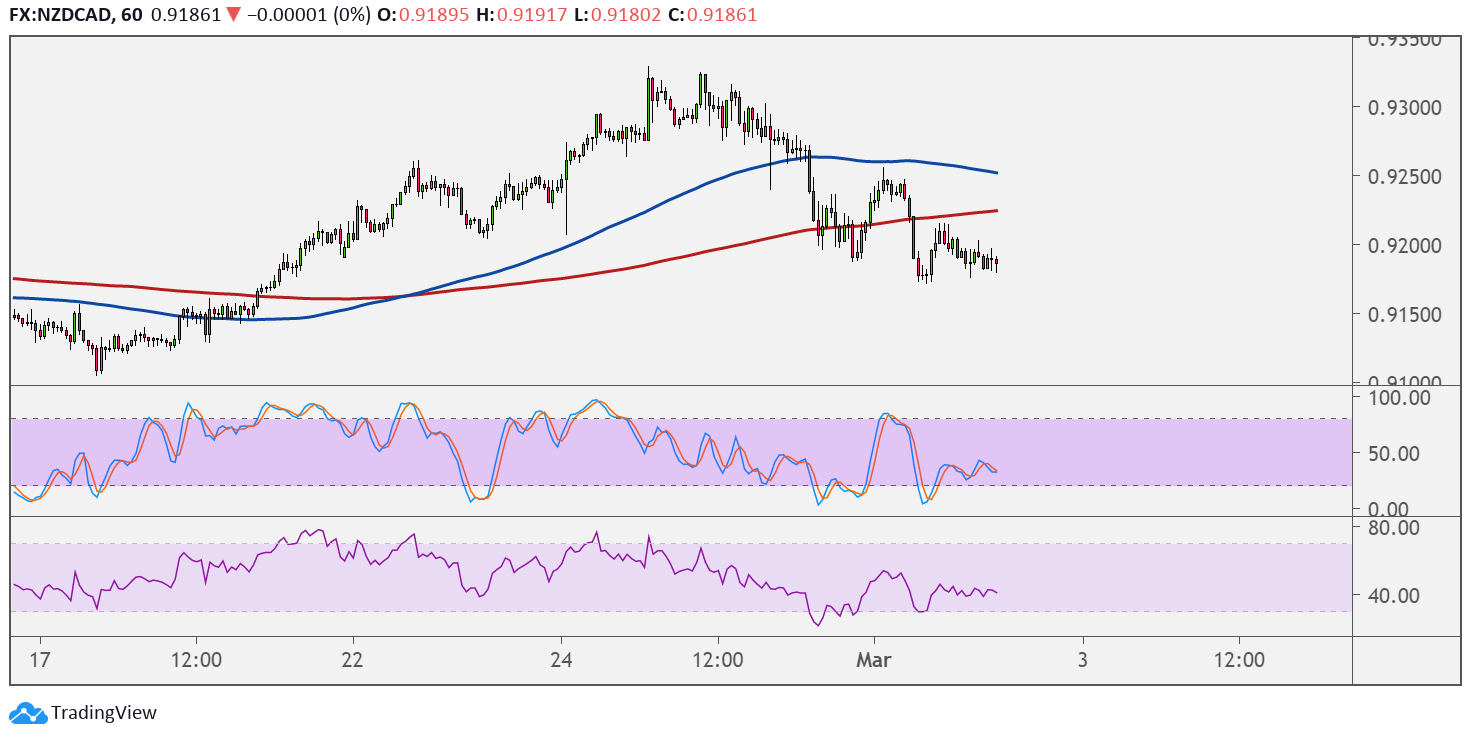
NZDCAD might be in for a reversal from its climb as price is forming a head and shoulders pattern on its 1-hour chart. A break below the neckline support has already taken place, so the pair could be in for a drop that’s at least the same height as the chart formation.
This head and shoulders pattern spans around 150 pips, possibly taking NZDCAD to the .9050 level next. However, technical indicators are still reflecting the presence of bullish pressure.

For one, the 100 SMA is above the 200 SMA to show that the path of least resistance is to the upside or that there’s a chance for the climb to resume. Then again, the gap between the indicators is narrowing to reflect slowing bullish momentum.
Stochastic is on the move up, so price could follow suit while bulls are in control. RSI is heading sideways to reflect consolidation, though.
Canada has its Ivey PMI up for release later in the week, and an improvement from 48.4 to 49.2 is eyed, reflecting a slower pace of industry contraction. Stronger than expected results could mean more gains for the Loonie, along with a pickup in crude oil prices.
Note that the OPEC-JMMC meetings are taking place throughout the week, and a stronger commitment to the output deal could mean more gains for the commodity. Apart from that, the inventory figures from the API and EIA could also impact crude oil and the correlated Loonie.
As for the Kiwi, there are no major reports due from New Zealand, so the commodity currency might simply draw cues from market sentiment. Strong risk appetite tends to be bullish for the Kiwi more than the Canadian dollar, especially since New Zealand is doing a fine job of weathering the pandemic.