
AUDCAD has been carving out a symmetrical triangle pattern since mid-May, with a descending trend line connecting lower highs and an ascending trend line connecting higher lows.
Price is currently caught in the middle of this tightening range, hovering around the 0.9820 area as the two boundaries converge. The upper trend line, currently near 0.9880, has capped several rally attempts, while the rising support line around 0.9800 has kept dips in check.

As these lines squeeze closer together, a breakout in either direction looks increasingly likely, and the height of the triangle could offer a rough guide to how far price might travel once it breaks free.
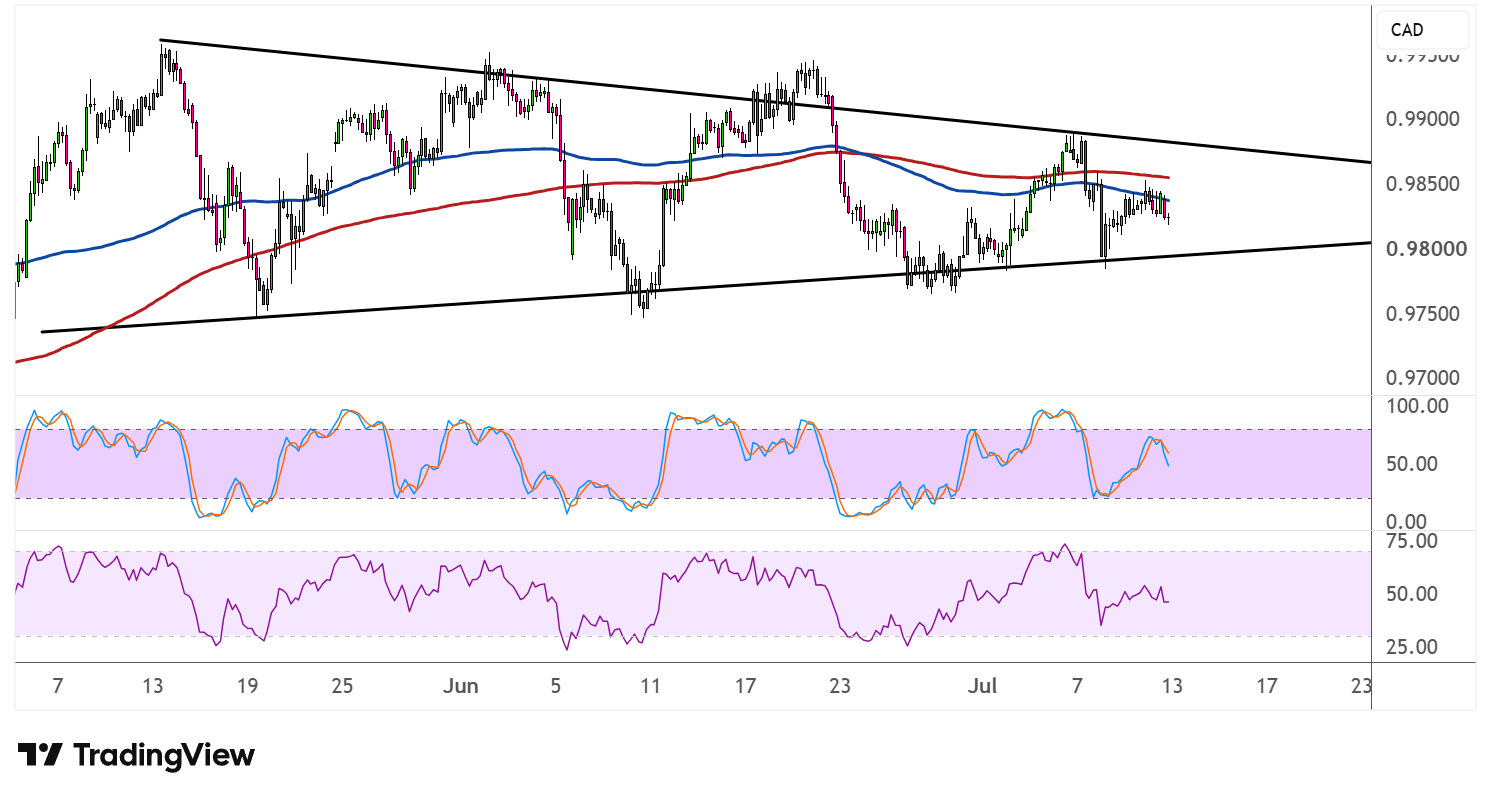
On the moving average front, the 100 SMA and 200 SMA are essentially flat and tangled together, reflecting the indecision baked into this consolidation. Neither average is offering much directional bias at the moment, reinforcing that the pair is stuck between the triangle boundaries and awaiting a catalyst.
Stochastic is on the move down from the overbought zone, hinting that bearish pressure could pick up in the short term and potentially test the rising support line. Still, the oscillator has been swinging sharply between overbought and oversold extremes throughout the consolidation, so whipsaws remain a real risk until a genuine breakout materializes.
RSI is also easing back from the upper half of its range, suggesting some fading bullish momentum for now. Like stochastic, it’s been oscillating within the same tight band, mirroring the indecisive price action.
A break above the descending trend line could open the door for a rally toward the measured move target derived from the triangle’s widest point, potentially eyeing the 0.9950 region or higher.
Conversely, a drop below the rising support line could set off a slide of similar magnitude, possibly dragging AUDCAD back toward 0.9700 or lower. Until then, traders may want to wait for a confirmed breakout with strong follow-through before committing to a directional bias.