
AUDJPY has pulled back to test a confluence of support near the 110.636 area, where an ascending trend line that has been guiding the pair higher since late January intersects with Fibonacci retracement levels. This zone also coincides with a former resistance area that has now flipped to support, making it a compelling region for buyers to re-enter.
If this floor holds, AUDJPY could resume the rally toward the 50% Fib at 110.84, then the 38.2% level at 111.58. A stronger recovery could push the pair back toward the swing high near the 0.00% Fibonacci level at 113.99, which marks the top of the prior advance and the next major upside target for bulls.

On the other hand, a break below the 61.8% Fib and the ascending trend line could open the door for a deeper decline toward the 100% Fibonacci extension at 107.69, which would signal a more significant reversal of the broader uptrend.
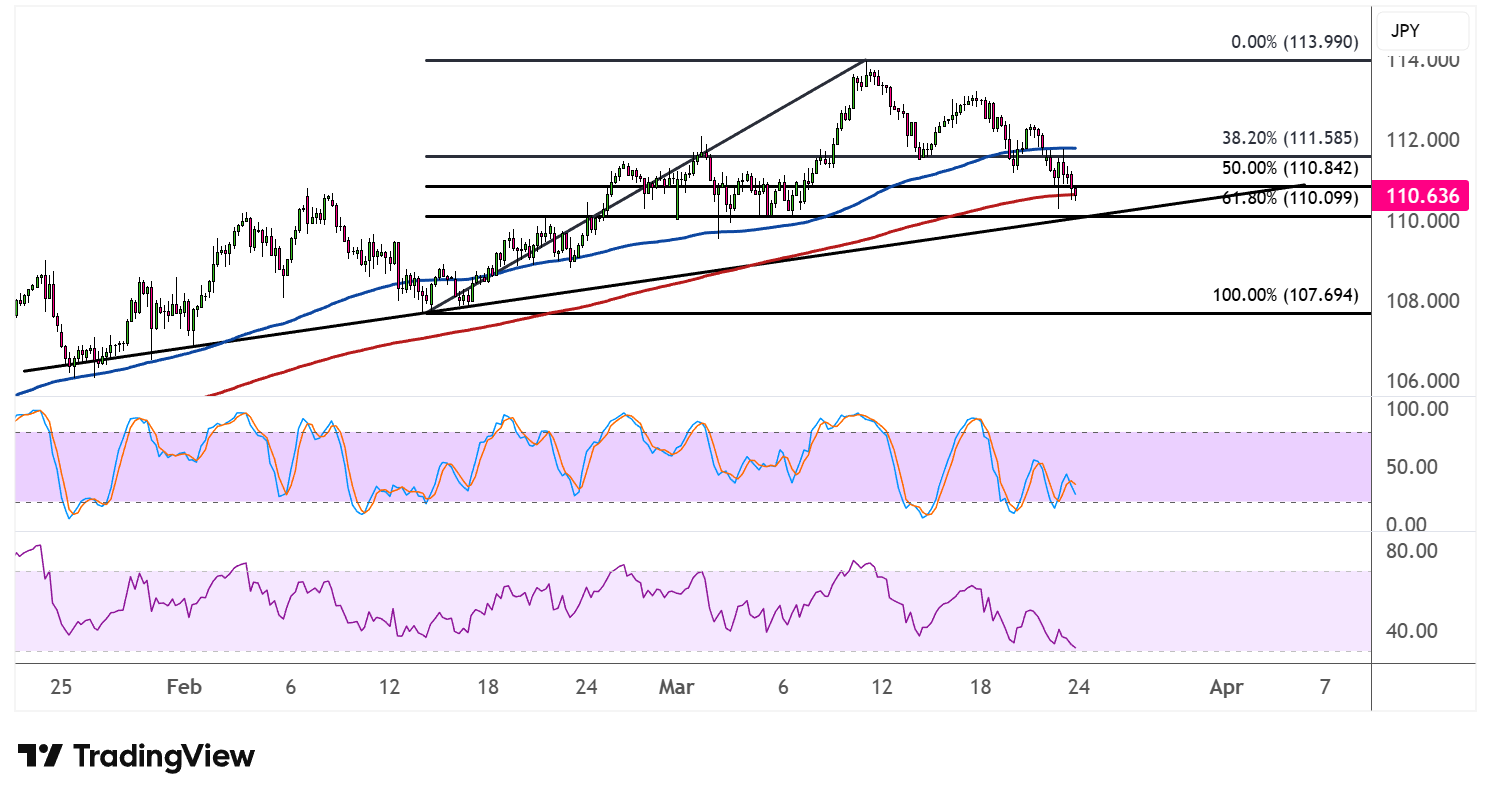
The 100 SMA is above the 200 SMA, confirming that the path of least resistance remains to the upside and that the climb is more likely to gain traction from here. Price is currently testing both moving averages, though, so a decisive hold above these dynamic levels would be needed to keep the bullish bias intact.
Stochastic has dipped into the oversold region and appears to be attempting a bullish crossover, reflecting exhaustion among sellers and a potential return of buying pressure. This lines up well with the trend line and Fibonacci support confluence below.
RSI, however, is still heading south with room to slide before reaching the oversold zone, suggesting that downside pressure could persist in the near term before buyers step in decisively to resume the uptrend.
AUDJPY could take cues from Australia’s upcoming inflation report, as strong figures could cement May RBA tightening expectations. Risk-taking from geopolitical developments could also influence the pair’s trajectory.