
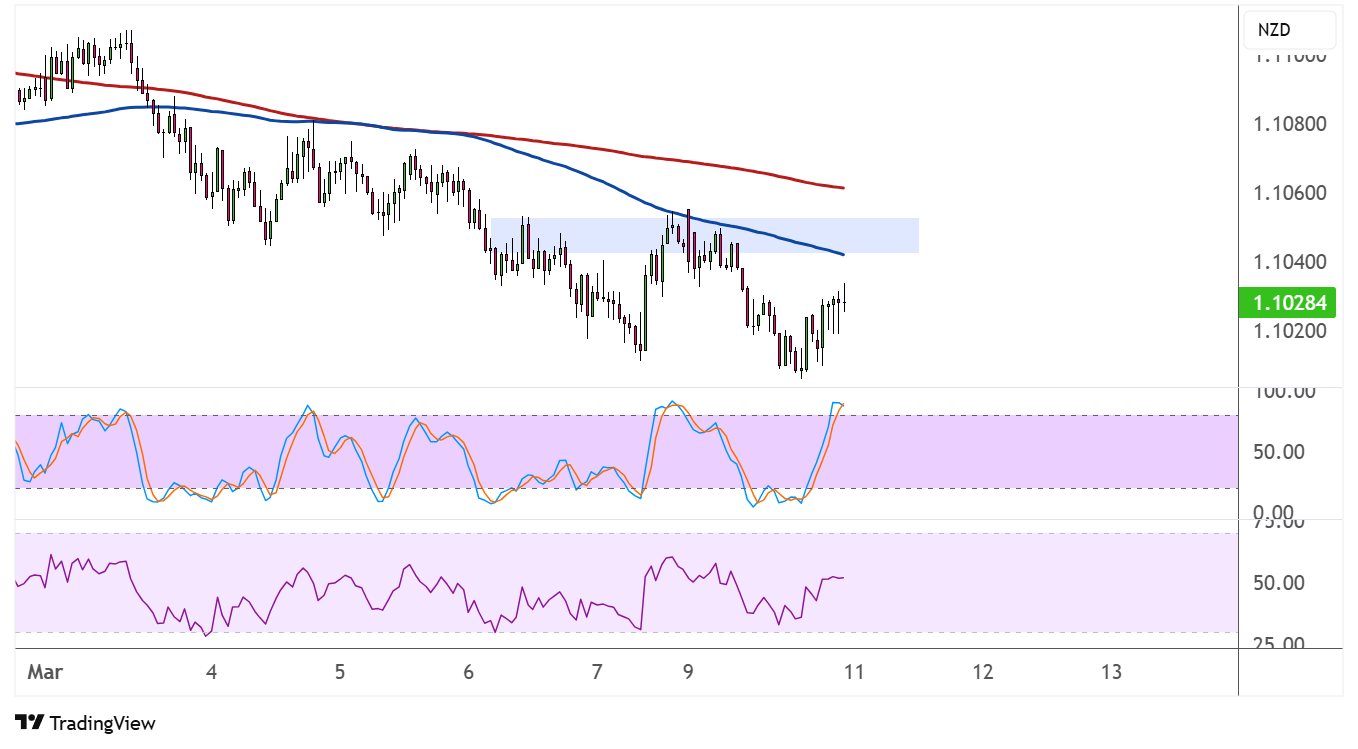
AUDNZD failed in its last couple of attempts to break below the 1.1000 area, creating a double bottom pattern on its hourly time frame. Price has yet to test the neckline resistance around the 1.1050 minor psychological level.
A break above this could confirm that a rally of the same height as the chart pattern is due. If resistance holds, on the other hand, AUDNZD could resume the drop to the lows or create fresh ones.

The 100 SMA is below the 200 SMA to suggest that the path of least resistance is to the downside or that support is more likely to break than to hold. The gap between the indicators is even widening to reflect strengthening selling pressure.
At the same time, stochastic is indicating overbought conditions to show that buyers are getting exhausted, so turning lower would mean that selling pressure is picking up. RSI has more room to climb, though, so buyers could still stay in control for much longer.
AUDNZD could take cues from overall market sentiment, especially as China’s retaliatory trade measures on the US are taking effect. Over the weekend, the Chinese economy printed weaker than expected CPI and PPI figures, leading to notable concerns about deflation in the country.
Further trade tensions could bring more downside for AUD due to Australia’s closer trade ties with China compared to New Zealand. Meanwhile, easing trade tensions could provide a bit of relief rally benefitting AUD, given how the RBA is less dovish compared to the RBNZ.
There are no major data points from Australia and New Zealand throughout the week, although China has its new loans report due. More signs of weakness could bring downside for AUD, as traders could worry about the repercussions on Australia’s commodity exports.