
AUDUSD has completed a textbook double top formation, with the pair breaking decisively below the crucial neckline support around 0.6500.
The commodity currency appears to be staging a corrective pullback toward the broken support level, which could now serve as dynamic resistance and provide an optimal entry point for bearish continuation trades.

The double top pattern represents a classic reversal signal, indicating that the previous uptrend from the June lows has likely run its course. The breakdown below the neckline confirms the pattern’s validity and suggests further downside momentum should materialize once the current retracement phase concludes.
The Fibonacci extension levels plotted on the chart offer compelling bearish targets should the selloff resume. The 38.2% extension at 0.64549 represents the first area where buyers might attempt to defend, followed by the 50% level at 0.64386.
However, a more substantial decline could target the 61.8% extension at 0.64224, with the 76.4% level at 0.64023 marking a deeper correction zone that aligns with the full projection of the double top pattern.
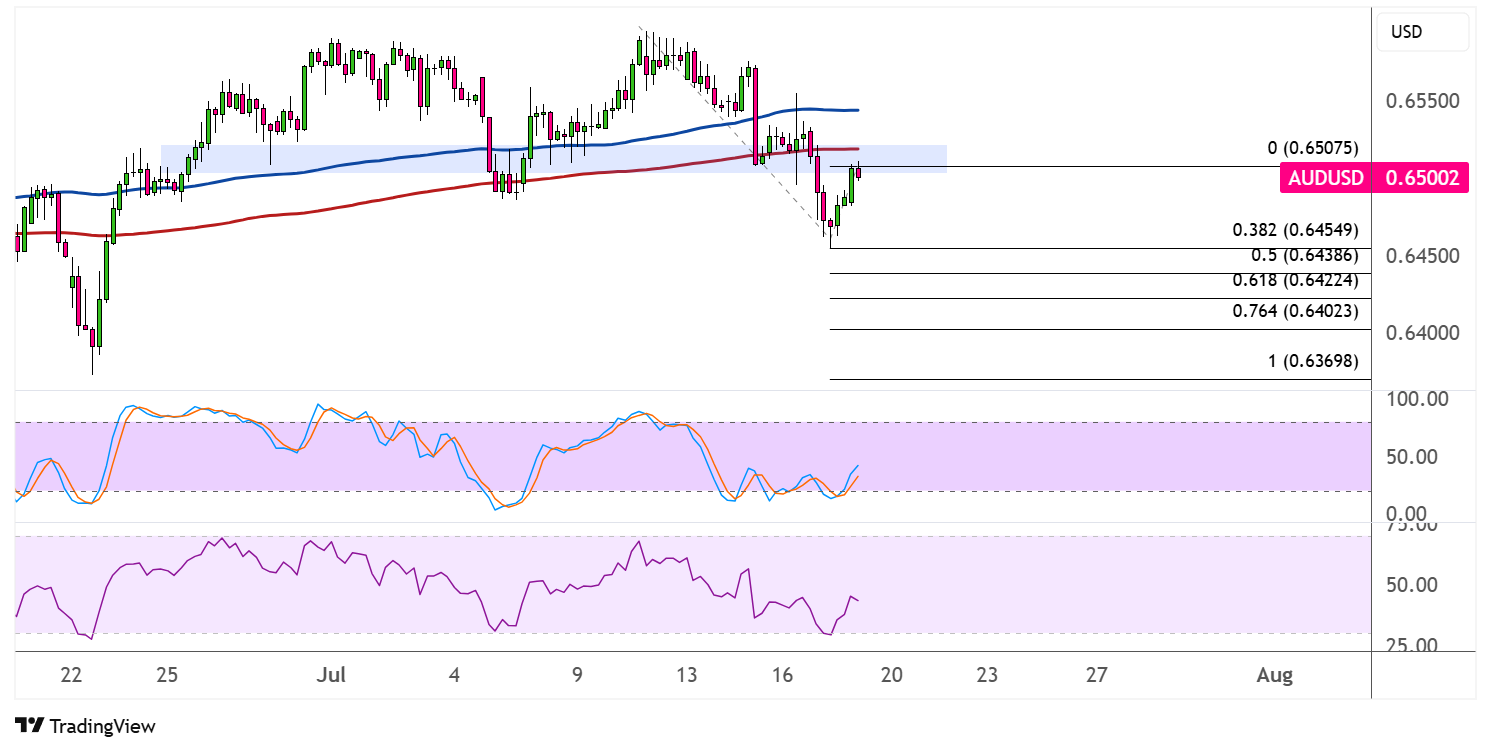
Moving average dynamics have turned bearish, with price action now trading below both the 100 and 200 SMAs. The red and blue moving averages are beginning to converge, signaling that the bullish crossover that supported the earlier rally is losing steam. This technical deterioration confirms that the path of least resistance has shifted to the downside.
The stochastic oscillator is attempting to bounce from oversold territory, which supports the current pullback scenario. However, RSI readings remain in bearish territory with ample room to decline further, suggesting sellers maintain control of the medium-term direction.
Weaker than expected jobs data released earlier in the week has cast doubts on the RBA’s policy shift, weighing on AUD after Chinese data came in mixed, while strong US retail sales data has propped up the dollar on lower odds of further Fed easing.