
AUDUSD is currently trading within a symmetrical triangle pattern, with the price hovering around 0.6444. This consolidation pattern has been forming since early May, with the upper resistance line connecting the lower highs and the lower support line linking the higher lows.
The pair recently bounced off the ascending support trend line of the triangle, showing some resilience from buyers. However, the bullish momentum appears to be losing steam as price approaches the descending resistance line around the 0.64600 area.

A decisive breakout from either boundary of this triangle could signal the next directional move for the pair, potentially lasting by the same height as the chart formation or around 150 pips.
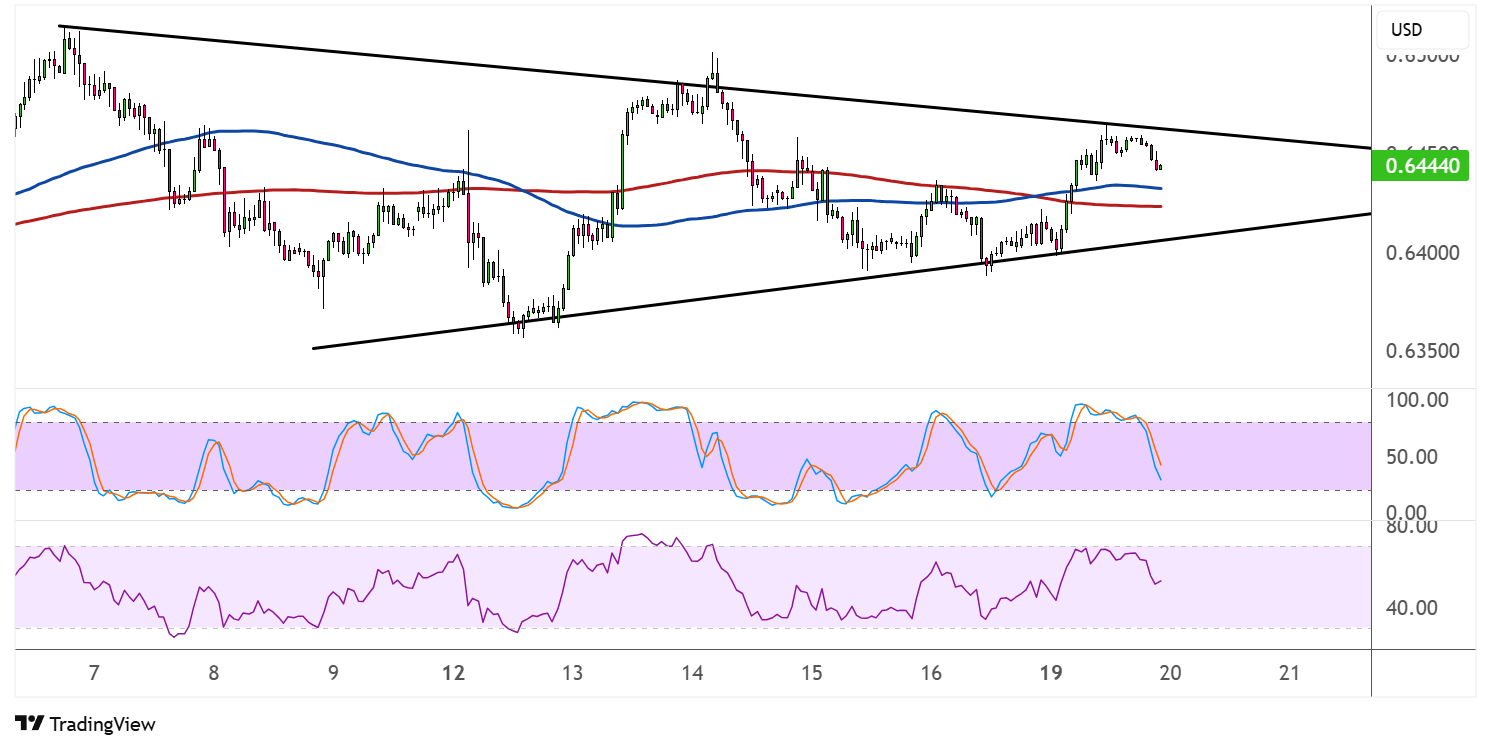
Looking at the moving averages, the 100 SMA (blue line) is positioned below the 200 SMA (red line), suggesting that the path of least resistance might still be to the downside. However, price is currently trading above both moving averages, which could provide dynamic support in case of pullbacks. The 100 SMA around 0.64250 serves as the first layer of support, followed by the 200 SMA near 0.64400.
The stochastic oscillator is heading south from the overbought zone, indicating that bearish pressure could still pick up. The oscillator has plenty of room to slide before reaching the oversold region, suggesting that the correction might continue in the near term.
Similarly, the RSI is also moving lower after approaching overbought territory, confirming the waning bullish momentum. This oscillator is now hovering around the midpoint, indicating neutral momentum with a slight bearish bias.
The Moody’s credit rating downgrade on the US led to dollar weakness at the start of the week, as traders dumped USD-denominated assets before sentiment shifted leading up to the House passage vote on Trump’s tax bill. As for AUD, the upcoming RBA decision could provide direction, as a rate cut is eyed and further dovish remarks could keep easing expectations in play.