
Crude oil the bull break loose
The bull is trampling the bear as crude oil head higher and close near 2017 high. The bullish closure resulted from positive development on OPEC side. In the latest meeting, Saudi Arabia talks to extend production cap from March 2018 until the end of 2018. This month, OPEC next meeting will be held in Vienna on 30th November.
News from Iraq also contributes to the current appreciation of oil prices. The conflict between allies put Iraq and Kurdistan on power contest over Kirkuk’s oilfields. Iraq sent military operation to Kirkuk, following Kurdistan independence referendum which is not acknowledged by Iraq.

Traders could expect the bullish trend in crude oil continue in November if there is no change in the current situation.
Click here to see Oil October analysis
New Month
Monthly chart
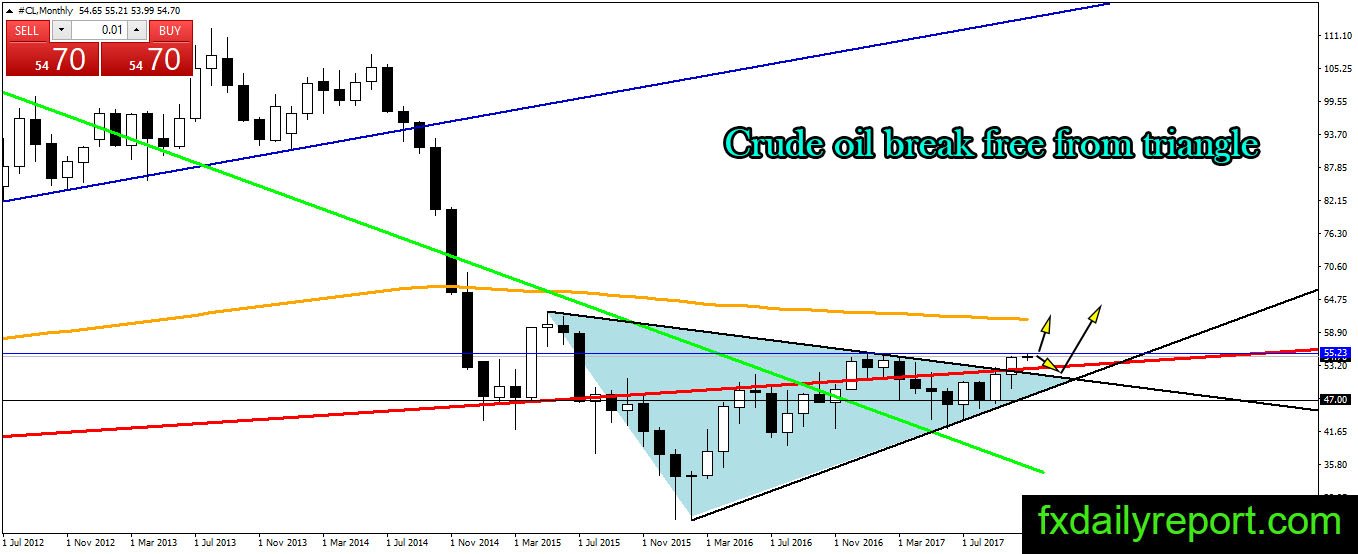
Crude oil on the monthly chart finally breaks free from triangle consolidation and head higher. The October candlestick closes extremely bullish, and crude oil is currently testing $55.23 resistance (2017 high). A breakout above the resistance will bring crude oil to test monthly SMA 200.
Weekly chart
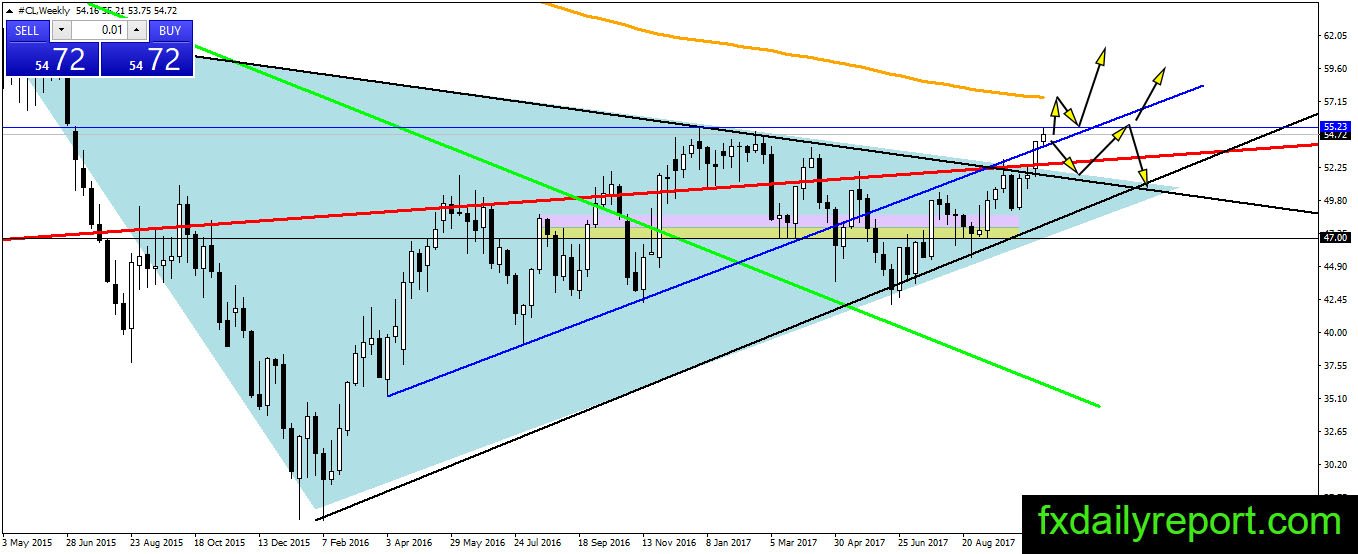
Crude oil traded higher above previous week high and currently testing $55.23 resistance. The trend has turned bullish after the break above triangle, but the bear still has a chance to nullify the breakout by bringing the price back inside the triangle. Traders could wait and see at current level while looking for a long opportunity near the triangle breakout level.
Daily chart

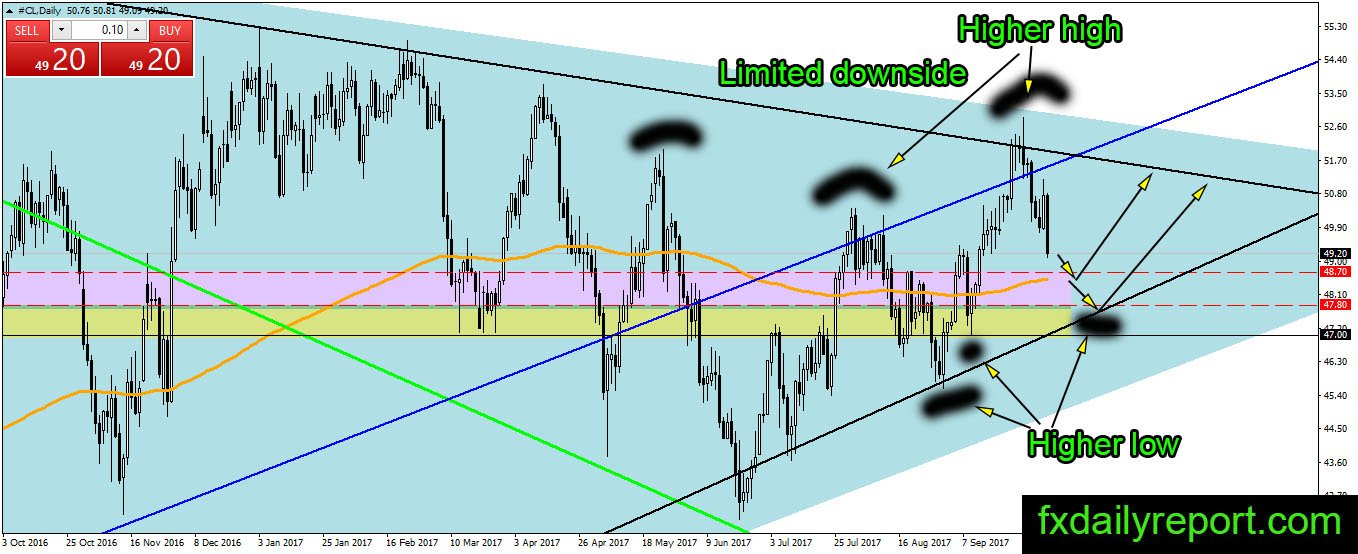
Crude oil scored bullish advantage, and the black gold formed new floor at $54.00 on the daily chart. The price expected to bounce between $54.00 – $55.23 until breakout happens. The odds are better for the bull as a move above $55.23 will trigger a short squeeze.
Trade plan
Bullish trade: Traders could look for long position near new floor $54.00
Bearish trade: Short position near $55.23 could be successful, but it is a short-term trade as crude oil trend turn bullish.