
Crude oil long-term projection
In the previous month, crude oil closed near its opening level and not far from the 50% Fibonacci Retracement level. The market is observing the development of trade war situations between the U.S and China. Both parties exchanged announcement and either denied or accepting the announcement made. The situation continue mixed but headed to possible deal in the coming month.
The trend of crude oil might continue sideways for now until there is further development.

Click here to see Oil October analysis
New Month
Monthly chart
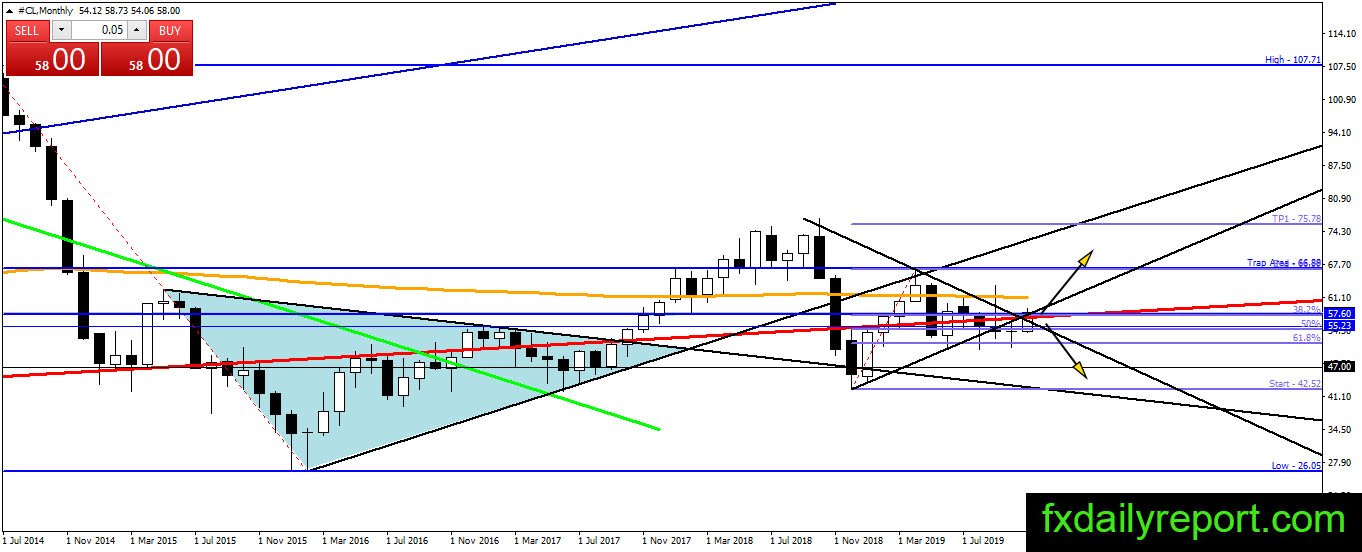
Crude oil maintains the status quo as the October closing price is near its opening level. This month, the bull attempt to bring the price higher but it could not surpass the 38.2% Fibonacci Replacement level easily. Next month’s trend will depend on the closing level of crude oil. Without a close above 38.2% Fibonacci Retracement level then crude oil will continue trade inside 38.2% – 61.8% range.
Weekly chart
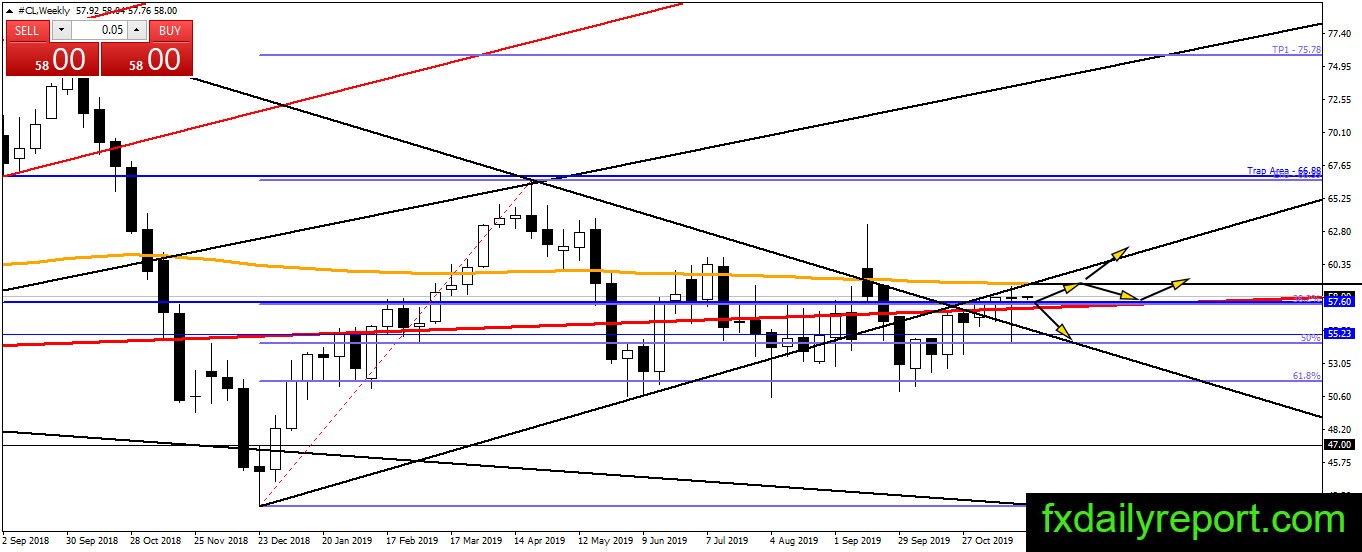
Weekly SMA 200 is the upward obstruction to watch by bull traders in crude oil. In the previous week, the price fell sharply and tested 50% Fibonacci Retracement level before bounced and close near its opening level. Crude oil might trade between $57.60 and weekly SMA 200 now until breakout happen.
Daily chart
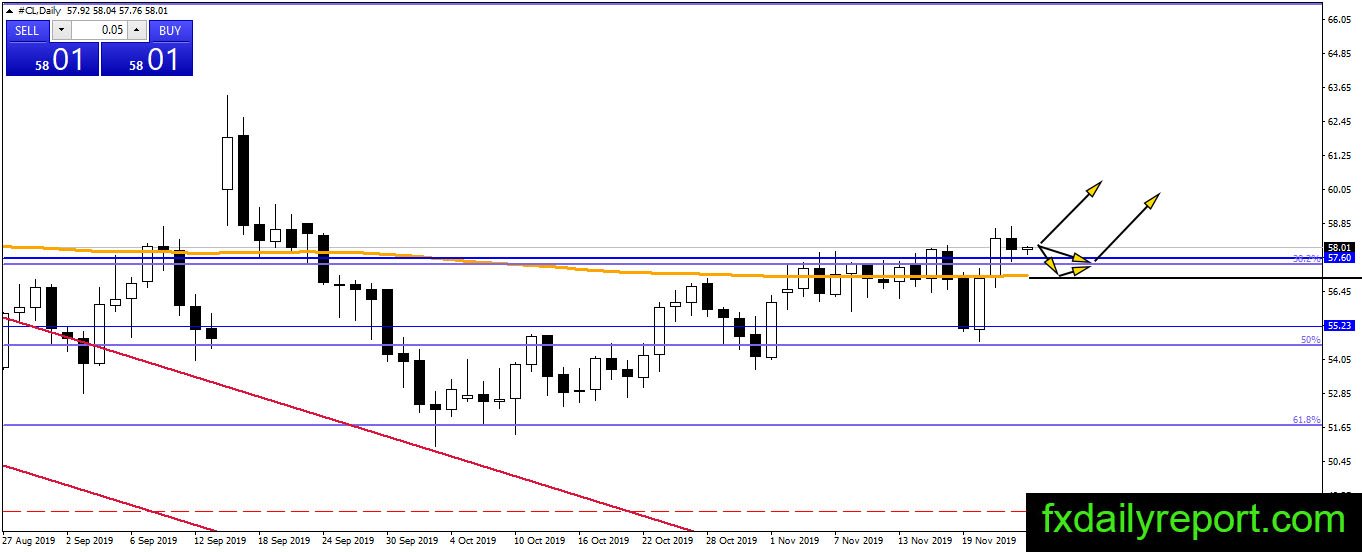

Crude oil climbed above daily SMA 200 and closed above it last week. The price finally makes significant bullish close but currently under pressure near $57.60. Traders could look for long positions near $57.60 and the daily SMA 200. A close below SMA 200 is a confirmation that the bullish attempt failed and traders might want to scale out of long positions.
Trade plan
The short-term outlook of crude oil seems positive after the price climbed above daily SMA 200. At the current time, crude oil is supported by $57.60 support level and SMA 200. Traders could look for long positions near both levels. Short positions will become possible only after a close below SMA 200 which followed by a close below previous week low.