
EURCHF is currently trading at 0.93633, finding itself in a triangle consolidation phase just below the significant resistance level at 0.94250.
The pair has been trading within an ascending triangle formation over the past several months, with price action now testing the upper boundaries of this formation.

Recent price movement shows EURCHF respecting the ascending trend line support that has been intact since early in the year. This rising support level coincides with the longer-term bullish structure, suggesting that buyers remain committed to defending higher lows.
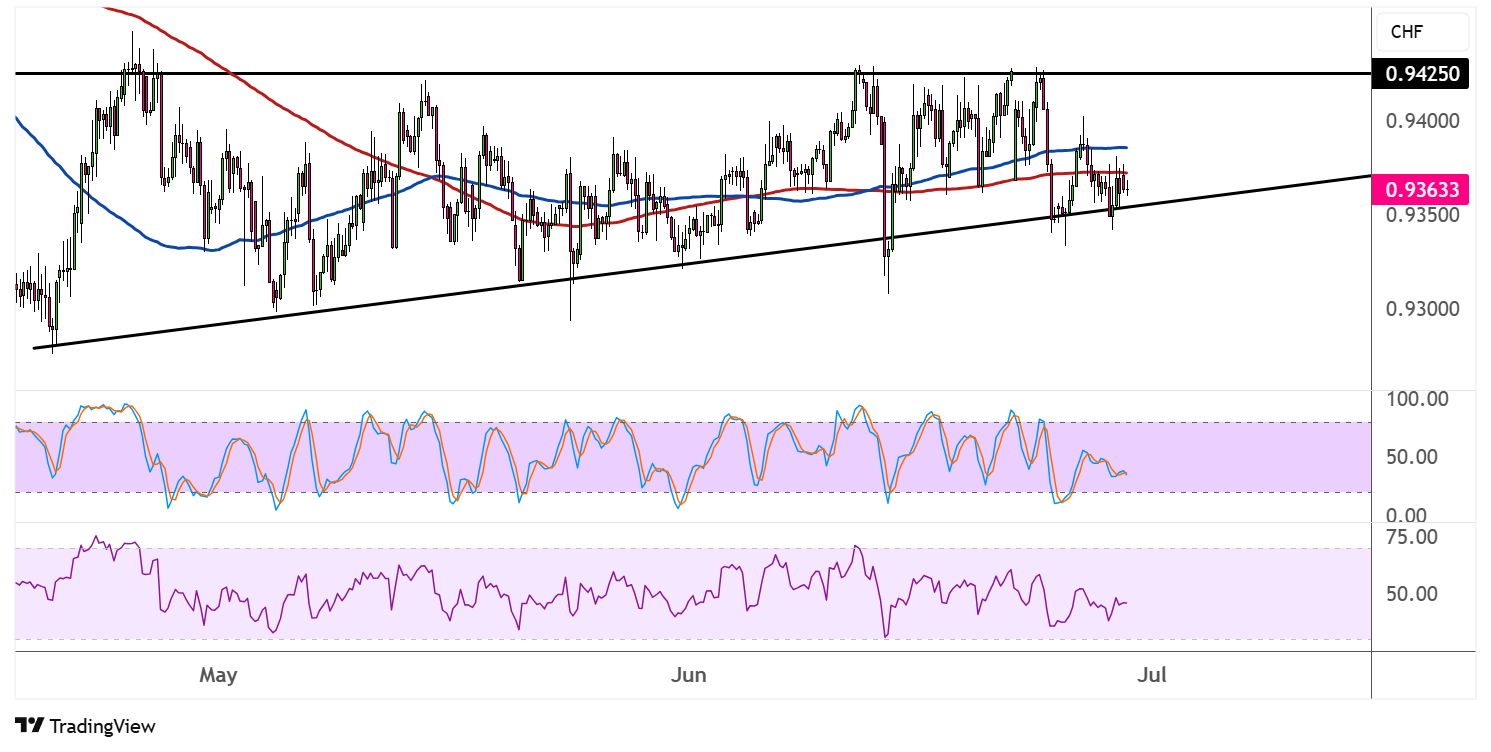
Moving averages continue to reflect the underlying bullish bias, with the 100 SMA (blue line) maintaining its position above the 200 SMA (red line). This configuration confirms that the path of least resistance remains to the upside, though the narrowing gap between the indicators suggests momentum may be waning.
Price is currently hovering around both moving averages, making this a crucial inflection point for near-term direction.
The stochastic oscillator is displaying mixed signals, oscillating between neutral and overbought territory without establishing a clear directional bias. This sideways movement in the oscillator mirrors the consolidative price action and suggests neither buyers nor sellers have gained decisive control.
RSI readings show the momentum indicator fluctuating around the 50 midpoint, reinforcing the neutral stance suggested by price action. The oscillator’s inability to establish a sustained move above 60 or below 40 indicates the current consolidation phase may persist.
A breakout above the 0.9425 resistance could target the psychological 0.9500 level, while a breakdown below the ascending trend line support around 0.9300 would signal a potential shift in the bullish structure.
The measured move for a potential break in either direction is roughly 125 pips or the height of the triangle formation, possibly dragging EURCHF down to .9175 in a breakdown or up to the .9600 major psychological resistance on a break higher.