
EURGBP has been on a steady decline since mid-December, respecting a descending trend line that has kept rallies in check. The pair recently bounced off the swing low around 0.8609 and is currently trading near 0.8652, potentially setting up for a pullback to former support that could now act as resistance.
The Fibonacci retracement tool applied to the recent drop shows where sellers might be waiting to defend against the corrective bounce. The 38.2% Fib is located at 0.8661, which lines up with a near-term area of interest. The 50% level is at 0.8677, while the 61.8% Fib sits at 0.8693, close to the descending trend line resistance.

If any of the Fibonacci levels or the trend line hold as a ceiling, EURGBP could resume its slide to the swing low or even set new lows. On the other hand, a break above the 61.8% Fib and trend line resistance could invalidate the bearish setup and pave the way for a larger correction.
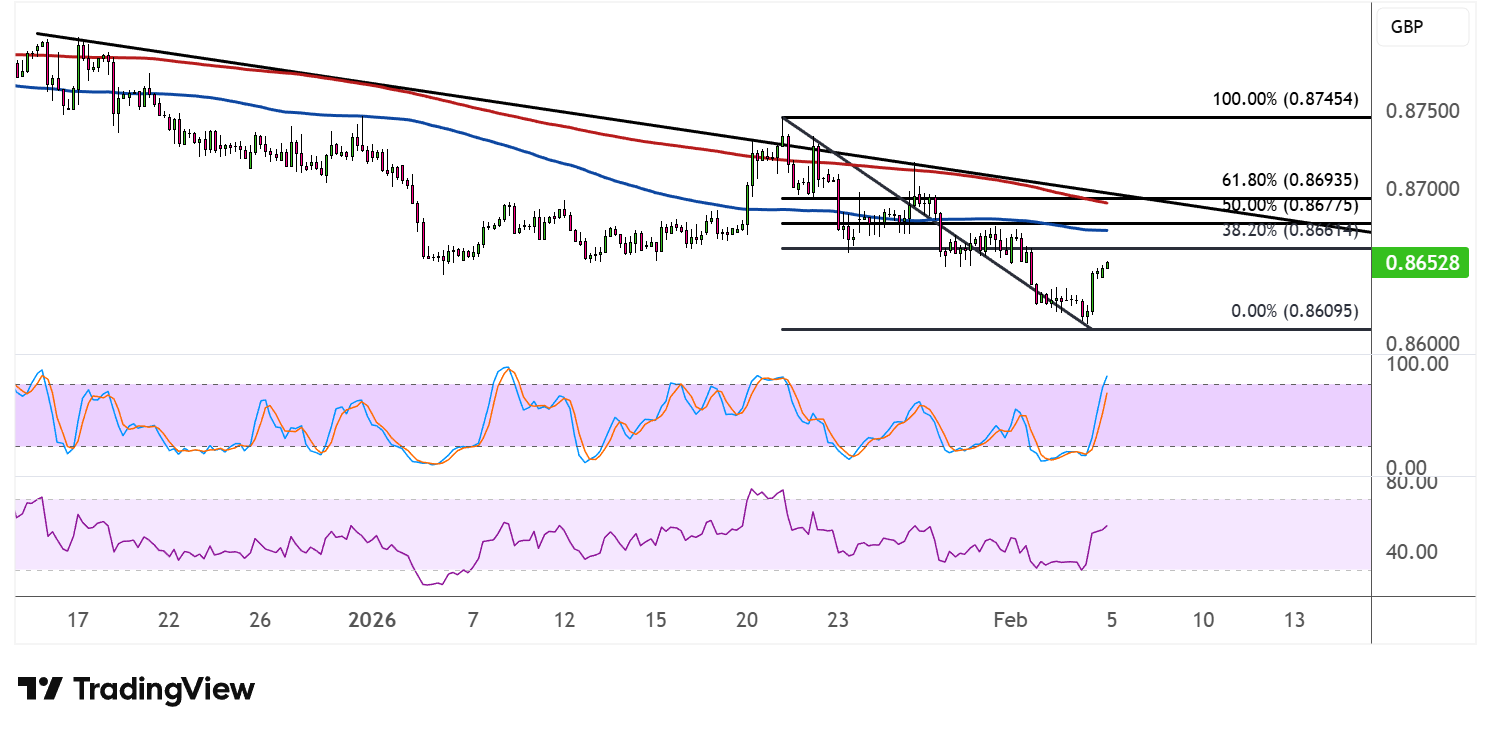
A look at the moving averages reveals that the 100 SMA (blue line) is below the 200 SMA (red line) to indicate that the path of least resistance is to the downside or that the selloff is more likely to resume than to reverse. Both dynamic indicators are converging with the descending trend line around the upper Fibonacci levels, creating a strong confluence zone that could cap gains.
Stochastic has climbed out of the oversold region and is currently hovering near the overbought area, suggesting that buying pressure might be starting to fade. The oscillator appears to be turning lower, which could mean that sellers are about to regain control and push the pair back down.
RSI is also heading north but has plenty of room to climb before reaching the overbought zone, so the correction could still extend for a bit. However, the indicator remains below the midpoint, reflecting that bears still have the overall advantage.