
EURGBP has formed a symmetrical triangle pattern on its short-term time frame, with price currently testing the bottom of the formation around the 0.8680 level.
This support zone is critical, as a bounce could lead to a rally back to triangle resistance while a break lower could signal the start of a steeper downtrend.

If the triangle bottom holds as support, EURGBP could stage a relief rally back to the mid-triangle area around 0.8695 or even test the triangle top closer to the 0.8720 handle.
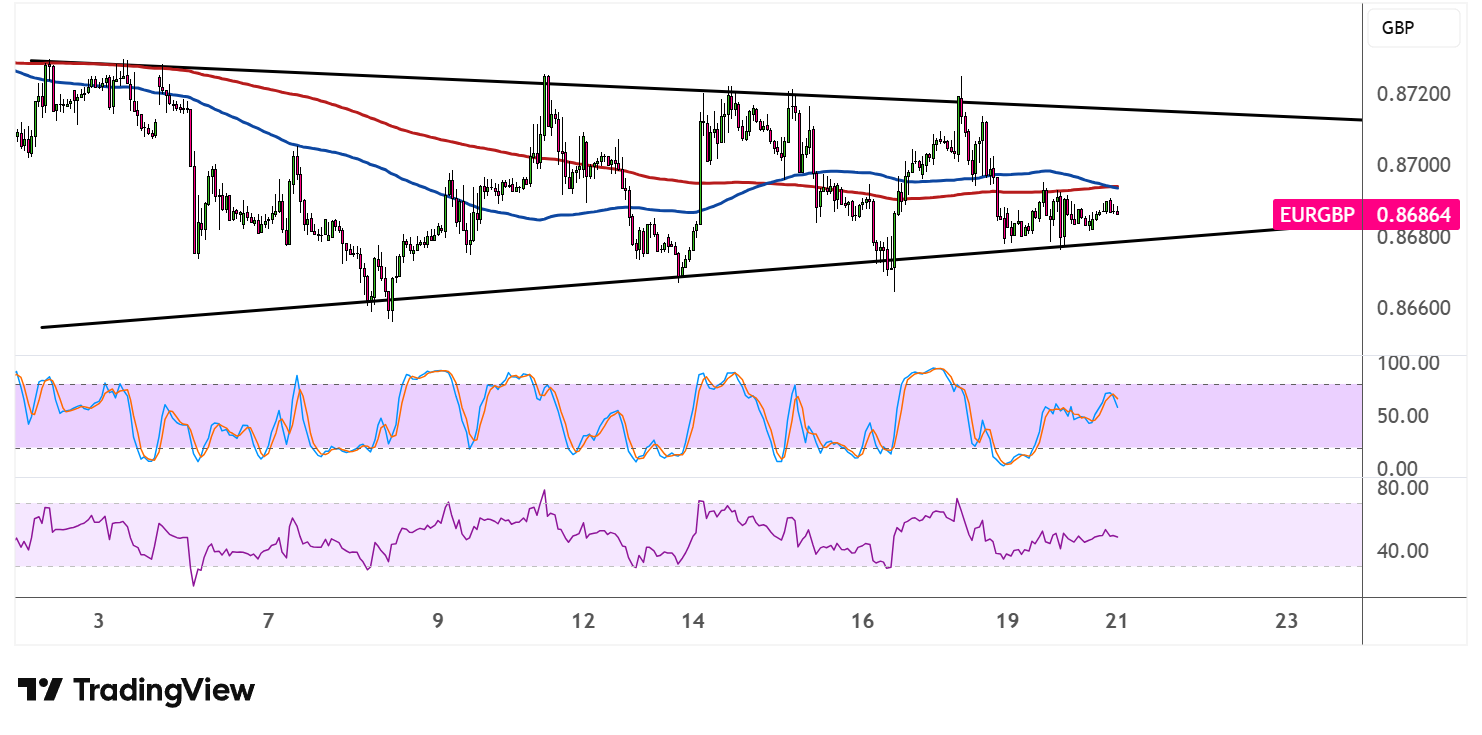
The 100 SMA and 200 SMA are converging near the upper portion of the triangle, which could serve as dynamic resistance on any attempted climbs.
The 100 SMA is positioned below the 200 SMA to suggest that the path of least resistance is to the downside or that there’s a chance the selloff could resume to new lows. However, the gap between the moving averages is relatively narrow, which means that momentum has not yet picked a clear direction.
Stochastic is hovering around the middle of the range, reflecting indecision between buyers and sellers at the moment. The oscillator has room to move in either direction, so watching for a clear turn higher or lower could provide clues on the next directional move.
RSI is also treading water near the 40-50 area, indicating that neither bulls nor bears have the upper hand just yet. A move below 40 could confirm strengthening selling pressure, while a bounce above 50 would suggest that buyers are defending support.
EURGBP is likely to take cues from upcoming economic releases from both the Eurozone and the UK, with both economies slated to print flash PMI readings by the end of the week. In addition, the UK is scheduled to release its CPI midweek and possibly influence BOE policy expectations.