
EURJPY has been riding a well-defined ascending trend line since the March lows, carving out a series of higher highs and higher lows that pushed the pair all the way up to the swing high near the 188.00 major psychological level.
Price has since pulled back from that peak and is currently trading around 186.24, with the correction now approaching a cluster of potential support levels that could attract fresh buying interest.

The Fibonacci retracement tool highlights where buyers could be waiting to step back in. The 38.2% Fib sits at 185.90 and coincides with a former resistance zone that could now flip to support, making it the first level to watch for signs of a bullish bounce.
A deeper pullback could reach the 50% Fib at 185.26, followed by the 61.8% level at 184.63, which aligns closely with the ascending trend line and could serve as the line in the sand for the broader uptrend.
If any of these hold as a floor, EURJPY could resume the rally back toward the 188.00 swing high or beyond. A break below the trend line and the 61.8% Fib, however, could open the door for a steeper decline toward the 100% extension at 182.56.
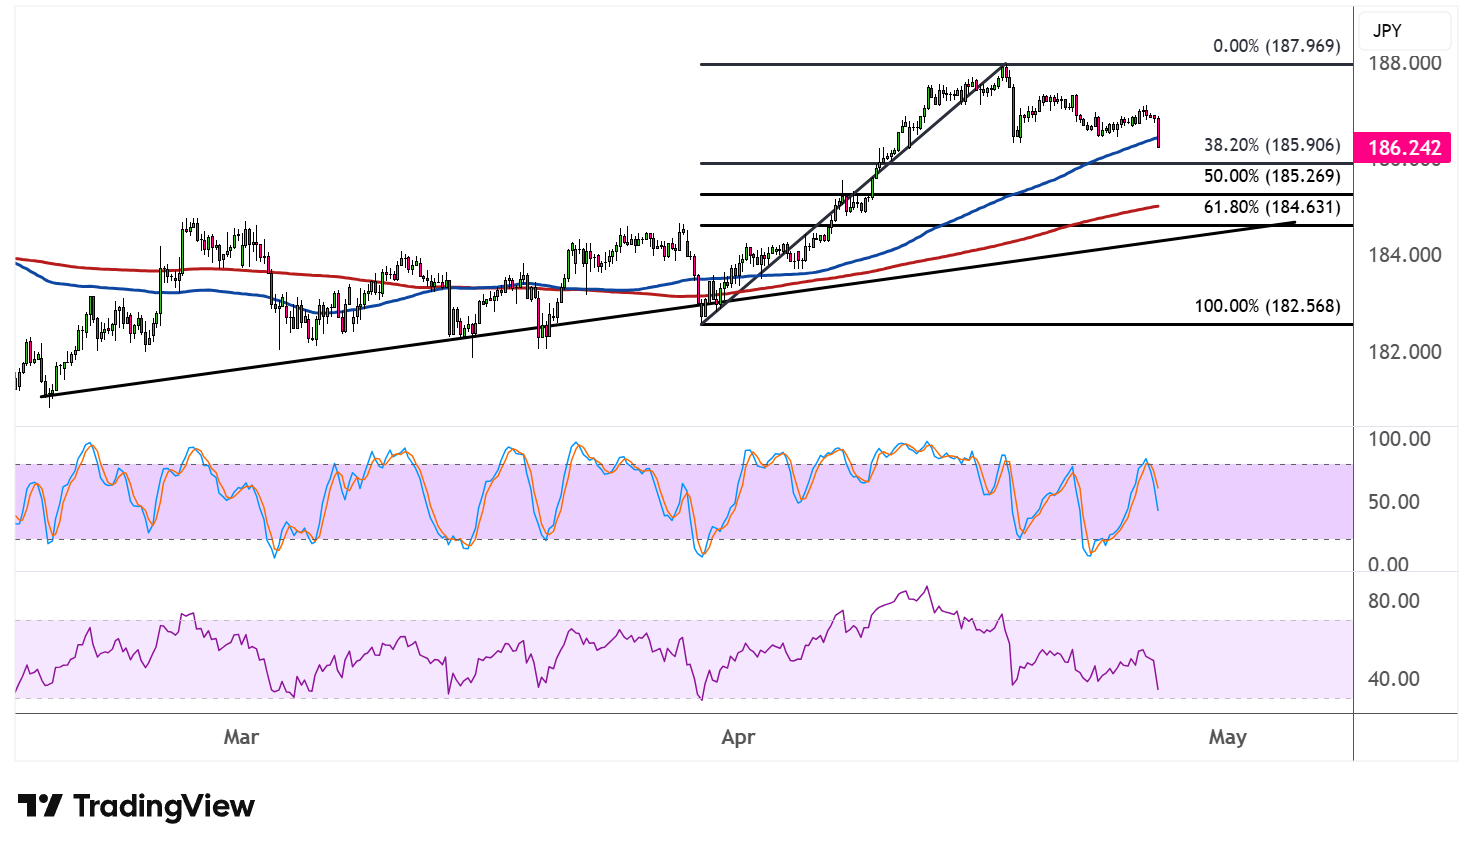
The 100 SMA is above the 200 SMA to confirm that the path of least resistance is to the upside, or that the climb is more likely to gain traction than to reverse. Price is still trading above both indicators, which could act as additional dynamic support as the correction deepens.
Stochastic has dipped into the oversold area, reflecting exhaustion among sellers and hinting that a bullish reversal could be just around the corner. The oscillator appears to be turning higher, suggesting that buyers may be eager to return at current levels.
RSI, on the other hand, still has some room to slide before reaching the oversold zone, so a bit more downside pressure could materialize before buyers fully regain control.