
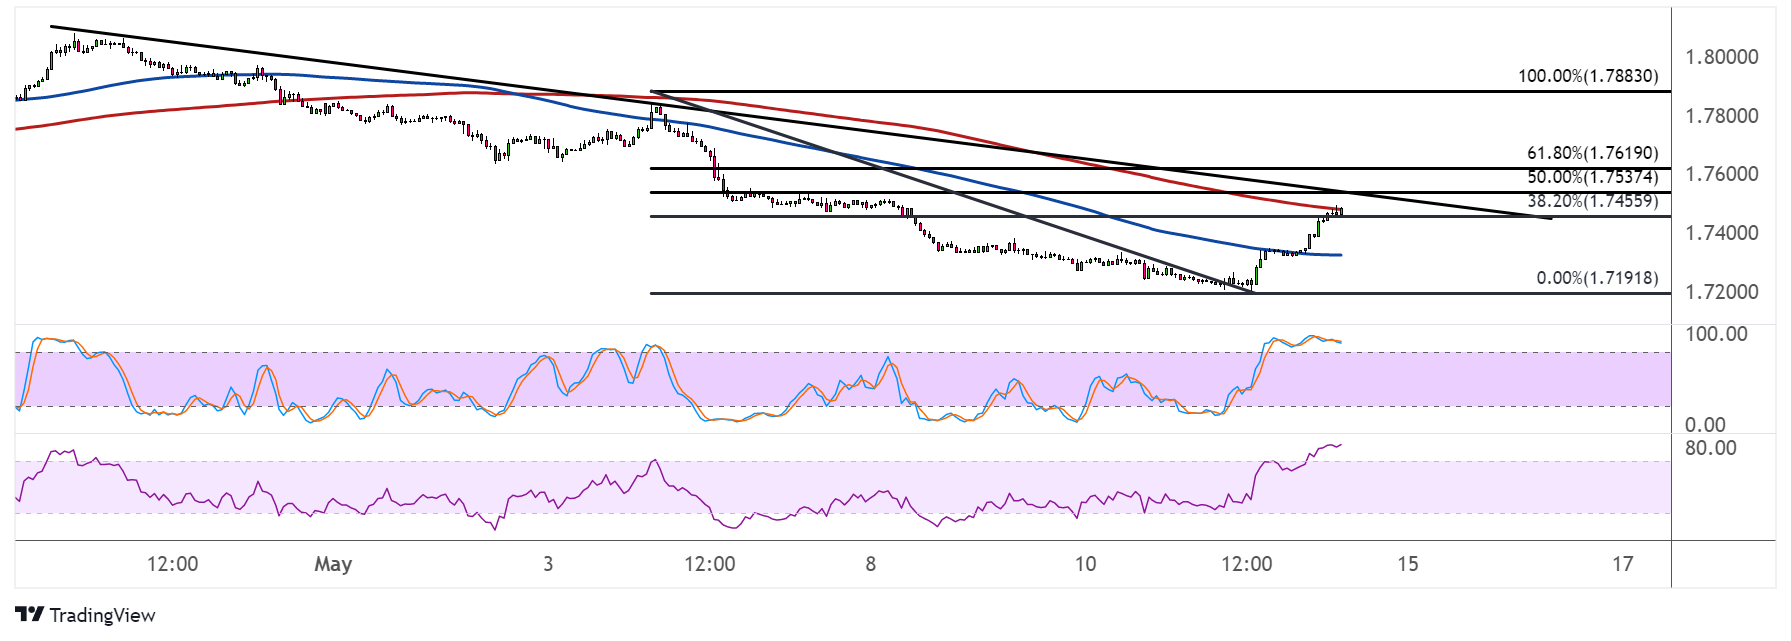
EURNZD has formed lower highs connected by a falling trend line visible on its short-term time frame. Another test of resistance seems to be underway, as the pair is approaching the Fib levels.
The 38.2% level is at 1.7455 while the 50% Fib is at 1.7537 near the trend line resistance. A higher correction could reach the 61.8% Fib at 1.7619, which might be the line in the sand for the downtrend.

The 100 SMA is below the 200 SMA to indicate that the path of least resistance is to the downside or that the selloff is more likely to resume than to reverse. Price is currently testing the dynamic resistance at the 200 SMA as well.
Stochastic has been indicating overbought conditions for quite some time, so turning lower would confirm a return in selling pressure. Similarly RSI is in the overbought zone to reflect exhaustion among buyers.
A bit of bearish divergence can also be seen for both oscillators, as these formed higher highs while EURNZD formed lower highs since early May. If any of the Fibs hold, the pair could resume the drop to the swing low at 1.7191 or lower.
There were no major reports out of the eurozone for the week, although mid-tier data like German industrial production and the Sentix investor confidence report reflected weaknesses. Still, hawkish ECB bets could continue to lift the shared currency as the central bank admitted it needs to do more to ward off inflation.
Still, risk-off flows favored the lower-yielding euro later in the week while the Kiwi reeled from downbeat Chinese inflation and trade data. This dampened optimism from the economy’s reopening early in the year, leading to expectations of weaker commodity consumption down the line.
In addition, slower inflation expectations and a drop in visitor arrivals also weighed on the New Zealand currency.