
EURUSD has formed a descending triangle pattern on its short-term time frame, characterized by lower highs connected by a falling resistance line and a flat support base around the 1.1650 minor psychological level.
Price is testing the triangle resistance and could be due for another dip to the bottom. Sustained selling pressure could trigger a downtrend while an upside break could spur a rally of the same height as the formation.

Based on the height of the triangle formation, EURUSD could decline by approximately 200 pips from the breakout point, potentially targeting the 1.1450 minor psychological level or lower in the coming sessions.
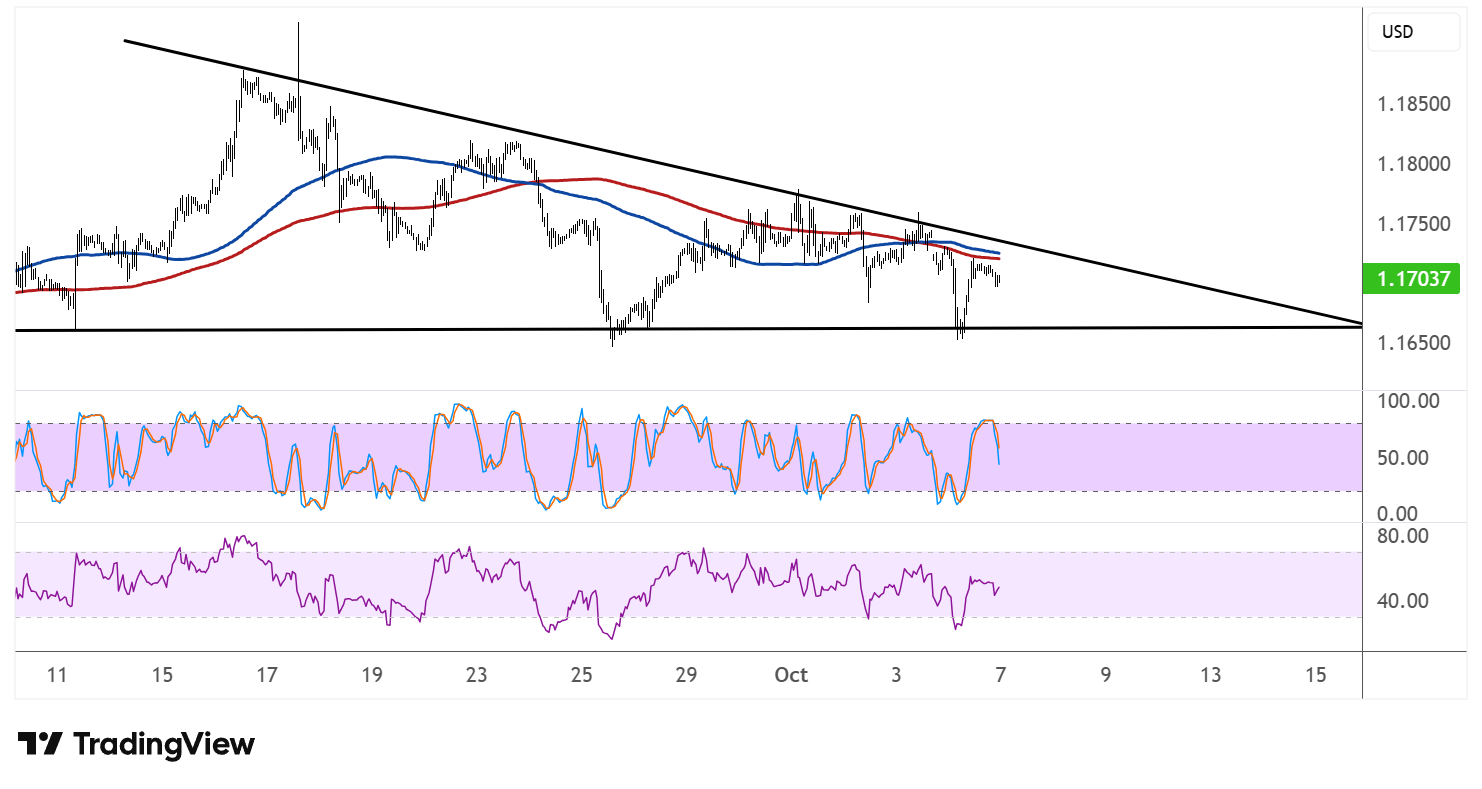
The 100 SMA (blue line) is below the 200 SMA (red line), confirming that the path of least resistance is to the downside or that the selloff is more likely to gain traction than to reverse. Both moving averages are positioned above the current price action, so these could hold as dynamic resistance if the pair attempts to stage a recovery.
The gap between the indicators is widening to reflect strengthening bearish pressure, although any bullish break above both SMAs could suggest a shift in market sentiment.
Stochastic is pulling up from the oversold region, indicating that buyers might be attempting a short-term correction. However, the oscillator has plenty of room to climb before reaching overbought territory, so any bounce could be limited unless momentum picks up significantly.
RSI is also turning higher from oversold conditions, suggesting some buying interest at current levels. Still, the oscillator would need to break past the 50.00 midpoint to indicate that bulls have regained control of the trend.
EURUSD appears to have been weighed down by political instability in France, but losses have quickly been limited as the US government shutdown is still keeping investors away from the dollar.