
GBPAUD has been consolidating inside a descending triangle formation on its short-term time frame, with price currently testing the top of the pattern around the 2.0300 major psychological resistance.
The pair appears to be drawing resistance from the falling trend line that’s been capping rallies since late October, while support is holding steady near the 2.0000 major psychological level.

A break above the triangle resistance could confirm a bullish breakout and set off a rally equivalent to the height of the formation, potentially taking GBPAUD up to the 2.0400 mark or higher.
On the other hand, rejection at current levels might lead to another drop back to the 2.0100 support zone or the triangle bottom near the 2.0000 major psychological level.
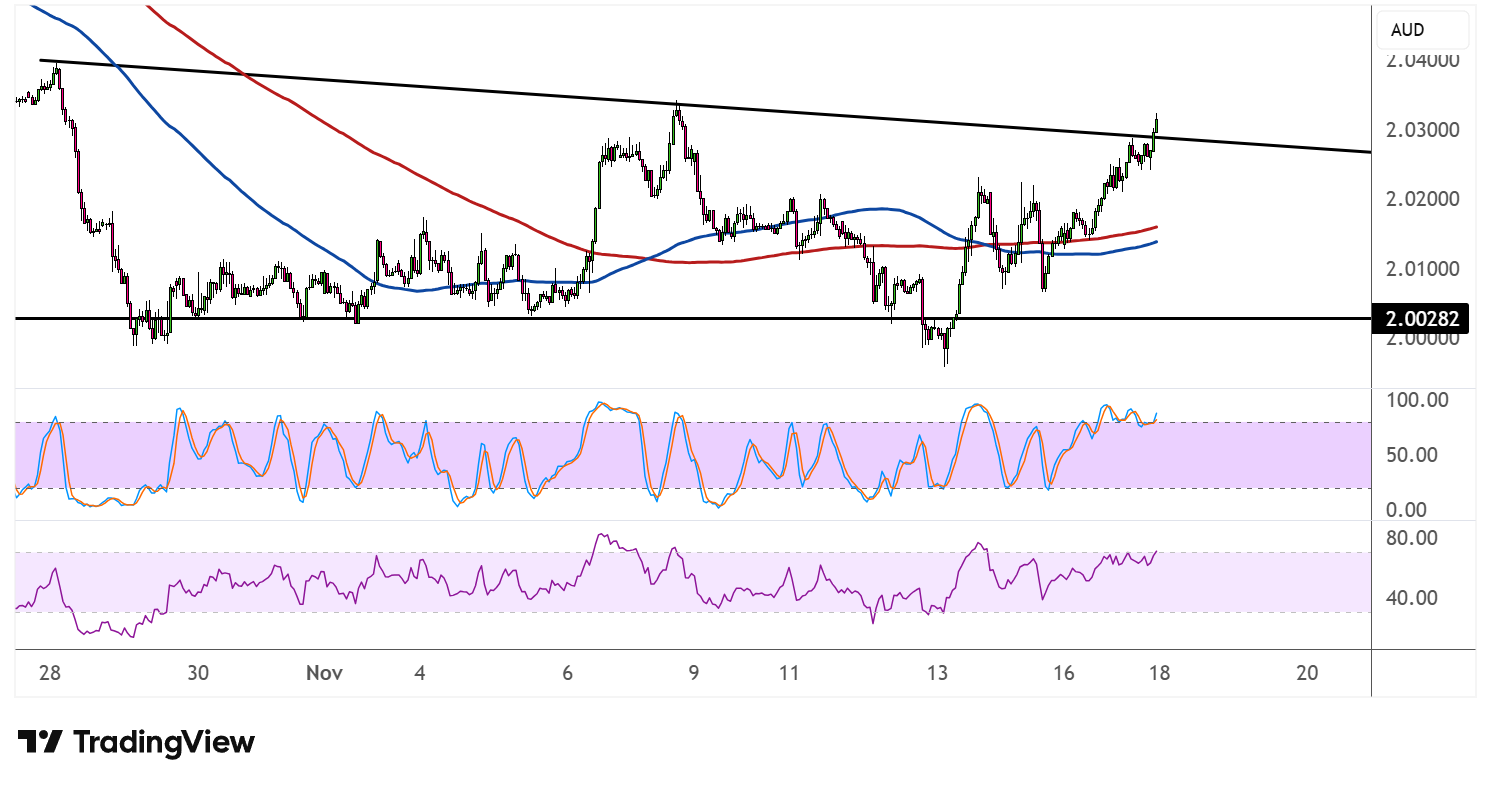
The 100 SMA is crossing above the 200 SMA to suggest that the path of least resistance could be shifting to the upside or that buyers might be regaining control. Both moving averages are also converging with the triangle support zone around 2.0100, reinforcing this area as a strong floor.
However, stochastic is hovering close to the overbought region to reflect exhaustion among buyers, so turning lower could mean that another test of support is in the cards. The oscillator has plenty of room to slide before reaching the oversold area, which means that a pullback to the triangle bottom could take place before any breakout attempts.
RSI is also treading higher but has some room to climb before indicating overbought conditions, so price could still edge up to test the triangle resistance more firmly while bulls are in control.
GBPAUD could take its cues from UK economic data, as the upcoming CPI release could seal the deal for December BOE easing if the numbers fall short of estimates. Risk aversion could mean more downside for the higher-yielding Aussie, though, if markets focus on Fed policy uncertainty and AI overvaluation concerns.