
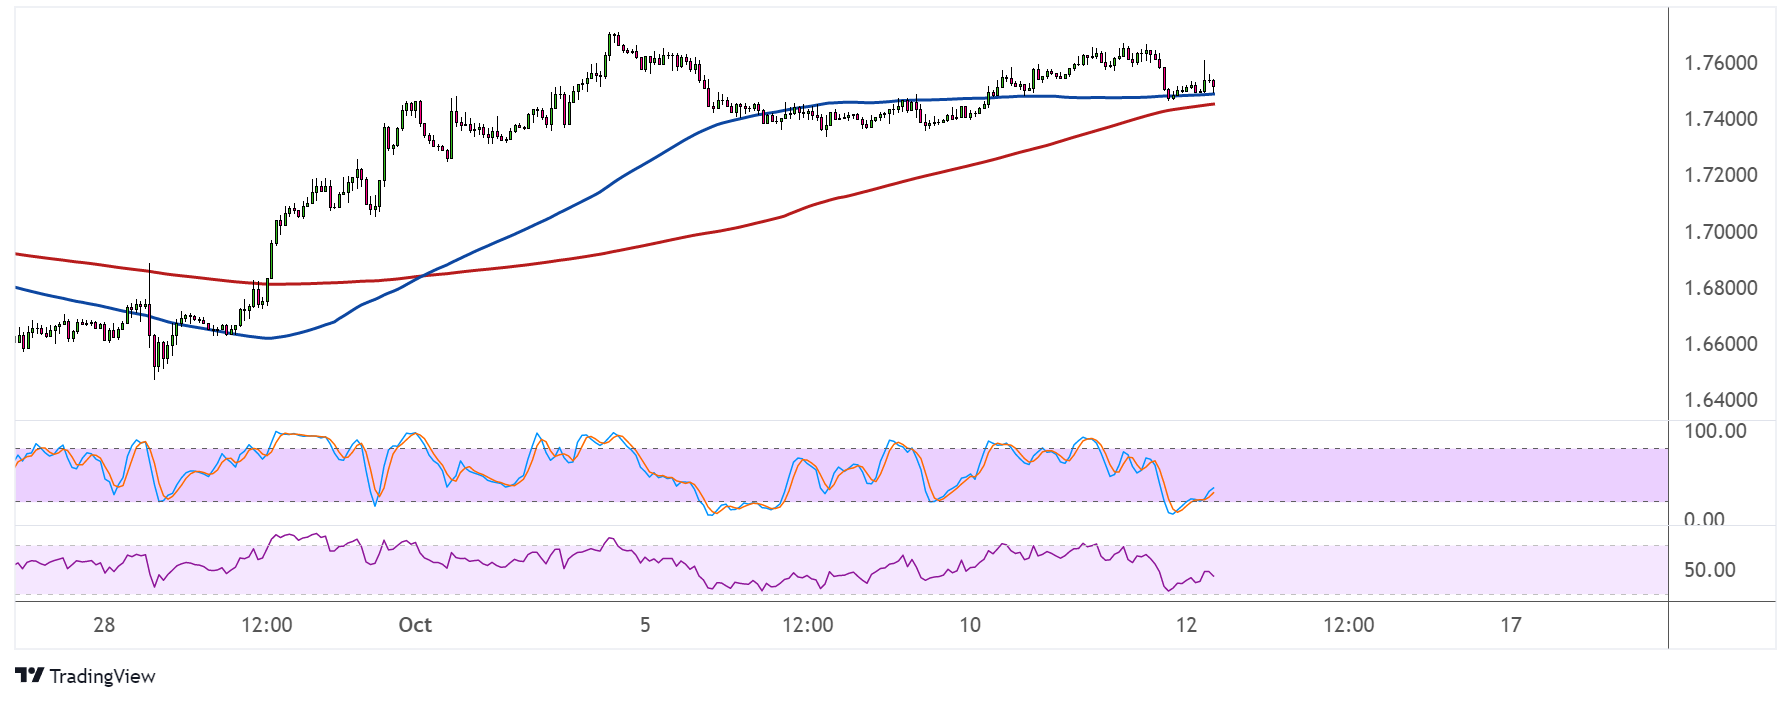
GBPAUD appears to be forming a double top pattern on its hourly time frame, indicating that the pair is done with its short-term uptrend. Price has yet to break below the neckline around the 1.7300 handle to confirm that a downtrend will follow.
If that happens, GBPAUD could slide by the same height as the chart pattern or around 300 pips. The 100 SMA is above the 200 SMA for now, but the gap between the indicators has narrowed significantly to hint at a bearish crossover.

Stochastic is pulling higher from the oversold region, though, signaling that buyers are regaining the upper hand while sellers take a break. The oscillator has plenty of room to climb before reaching the overbought region to reflect exhaustion among bulls.
Similarly RSI is pulling higher to show that buyers are in control. The oscillator did not even reach the oversold region, which suggests that bulls are eager to charge.
However, concerns about the U.K. bond market are currently weighing on the currency, especially since the BOE has been prompted to act in order to prevent further declines.
In addition, the latest jobs report printed dismal results, as the number of claimants rose by more than expected while the average earnings index pointed to stronger inflationary pressures.
Earlier today, the UK GDP reading for August turned out weaker than expected, as the economy contracted by 0.3% during the month instead of posting a flat reading. This follows a downgraded 0.1% growth figure for July.
Components of the report also reflected weaknesses across most sectors, with industrial production tanking by 1.8% versus the estimated 0.1% dip.
Meanwhile, the Aussie is also under bearish pressure on account of risk-off flows stemming from recession fears and another possible set of lockdowns in China. Headlines revealed that authorities are tightening testing measures in Shanghai and other cities once more.