
GBPAUD has been consolidating between Fibonacci retracement levels after a significant downtrend, with the pair currently hovering near the 38.2% Fibonacci level at 2.06919.
Price is moving within a narrowing range, suggesting that a breakout could be imminent. The current price of 2.06743 sits just below the 38.2% Fibonacci retracement, which appears to be acting as immediate resistance.

Looking at the overall Fibonacci structure, the price has been finding support near the 38.2% level (2.06919), while facing resistance at the 50.0% retracement level (2.07562). A decisive move above this level could push the pair toward the 61.8% Fibonacci at 2.08205.
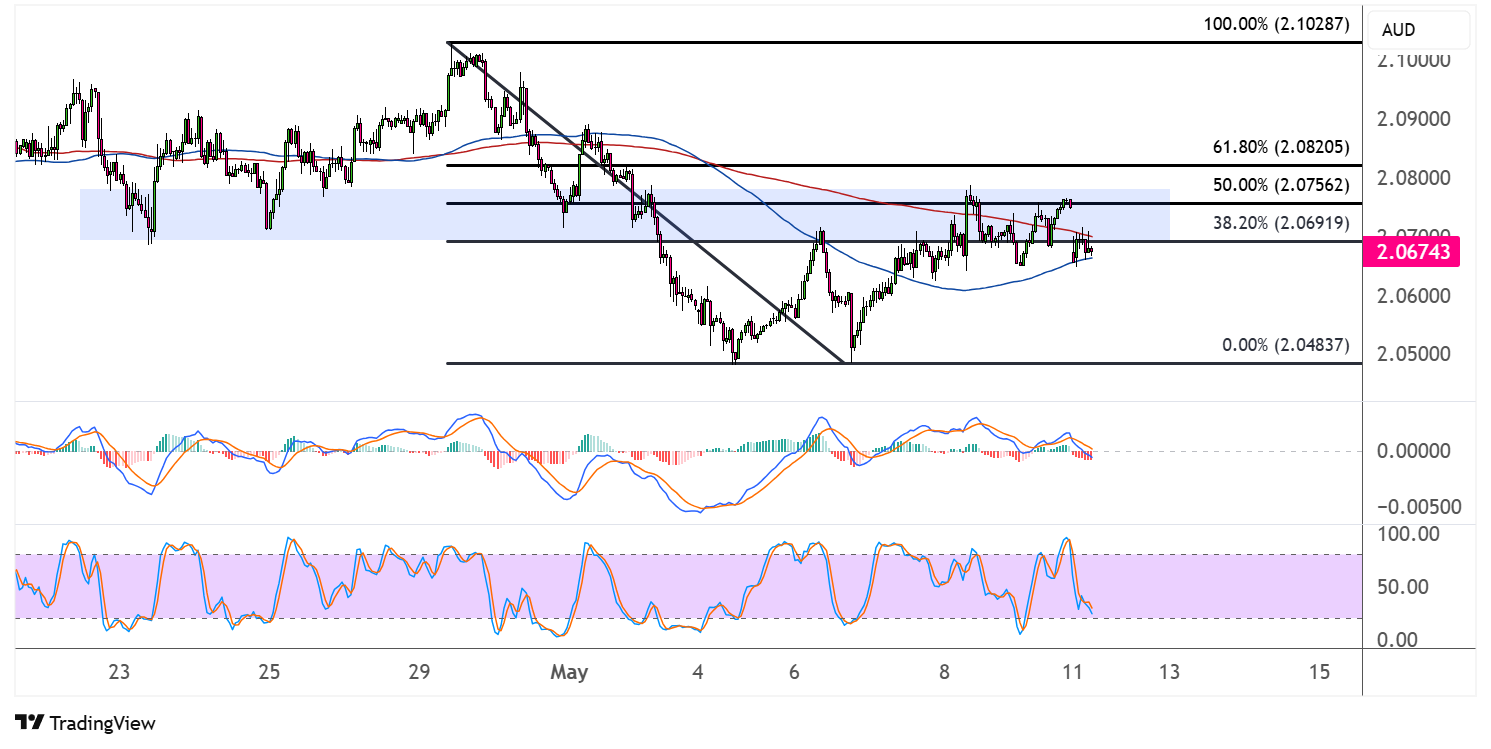
The moving averages paint a mixed picture. The 100 SMA currently sits below the 200 SMA, indicating that the path of least resistance might still be to the downside. However, the price has been consistently trading above both moving averages in recent sessions, which could signal building bullish momentum.
Stochastic is heading south from the midline, suggesting that bearish pressure could pick up in the near term. The oscillator has room to slide before reaching the oversold area, which means that the correction could continue until that happens.
GBPAUD could take cues from both UK and Australian economic data in the coming days. The UK has it jobs report coming up and markets are speculating that hiring and wage growth likely slowed significantly, possibly challenging the less dovish BOE outlook from the previous week’s statement.
Meanwhile, Australia also has its quarterly labor cost index due, followed by its April employment change figures. Stronger than expected results, coupled with positive trade developments, could mean more upside for the commodity currency.
Note that details on the US-China talks have yet to be released, and that Chinese President Xi has a speech scheduled on Tuesday that could provide more clues on how negotiations are going.