
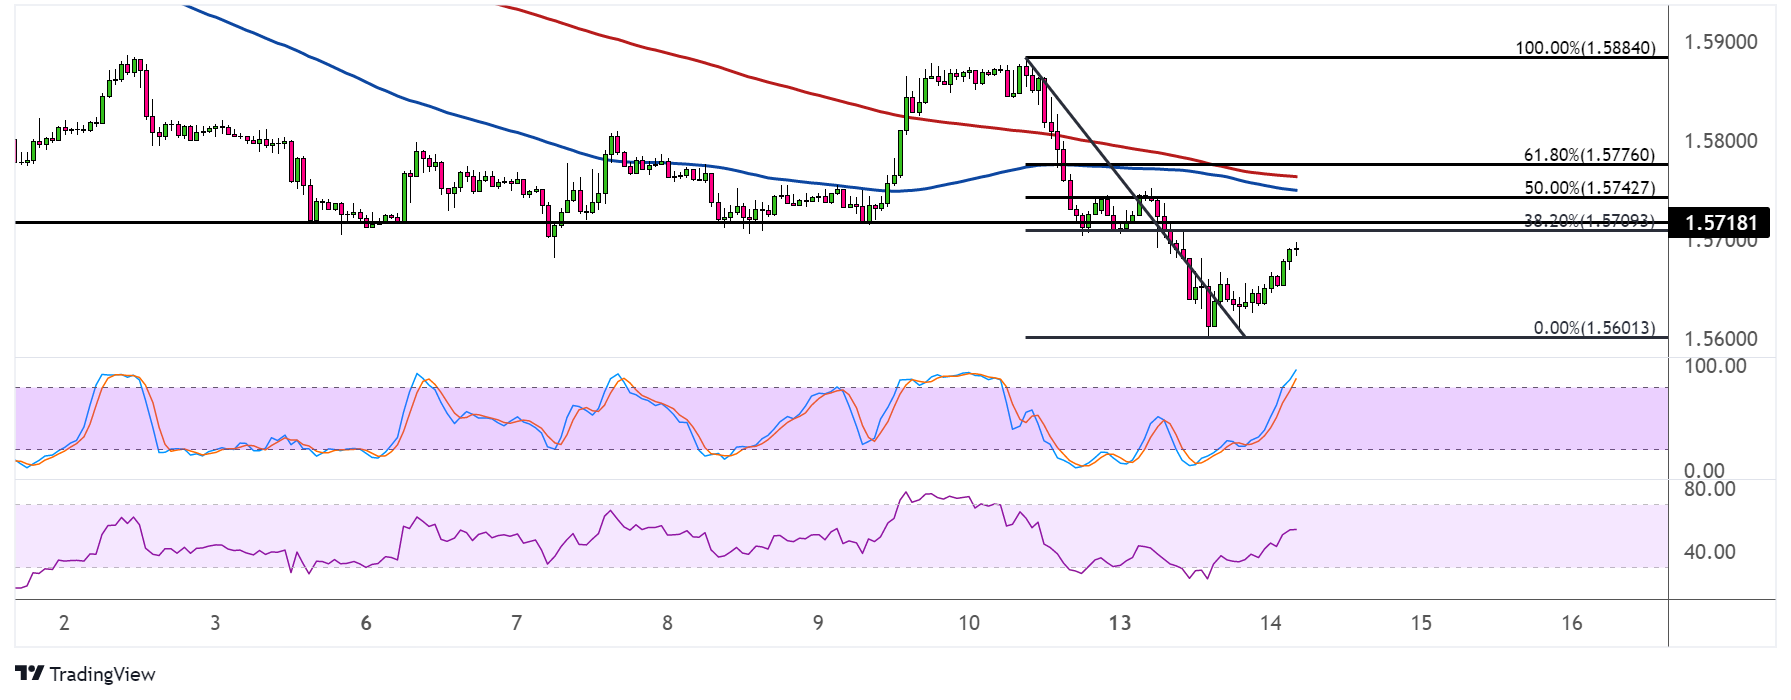
GBPCAD broke below the bottom of its short-term range and dipped to lows near the 1.5600 handle before pulling up. Price might retest the former support before gaining traction on its drop.
The Fibonacci retracement tool shows that this area of interest lines up with the 38.2% level and the 1.5700 major psychological level. A larger correction could reach the 50% Fib near 1.5750 and the 100 SMA or the 61.8% Fib at 1.5776.

If any of the Fibs hold as resistance, GBPCAD could resume the drop to the swing low or lower. Note that the former range spans around 185 pips in height, so the resulting selloff could be of the same height.
Stochastic is still heading north, but the oscillator is already closing in on the overbought zone to reflect exhaustion among buyers. Turning lower would confirm that sellers are taking over as buyers take a break.
RSI has more room to climb before reaching the overbought area, so buyers might be able to stay in control for much longer and push for a larger retracement.
The 100 SMA is still below the 200 SMA to confirm that resistance levels are more likely to hold than to break, although the gap is narrow enough to reflect weaker selling pressure.
The UK recently printed its latest monthly GDP and industrial production reports, and results have turned out weaker than expected. The economy contracted 0.3% in May versus expectations of a small growth figure while industrial production sank 0.6%.
Later in the week, the BOE will announce its policy decision and likely lift interest rates by 0.25% in order to combat rising inflation. A larger than expected hike might not have much of a bullish impact on GBP since a recession in the UK is already being priced in.
A dovish statement acknowledging these risks might mean even more downside for the UK currency.