
GBPCHF is trading at 1.0702 while consolidating inside a descending triangle formation, suggesting that a breakout could be imminent. The pair appears to be testing the triangle resistance around 1.0700, and a break higher could trigger a rally of the same height as the chart pattern.
However, price could still retreat to support at 1.06742, which has been holding as a floor since August. A break below this level would confirm that the downtrend is gaining traction and could set off a drop equivalent to the triangle’s height.

If GBPCHF manages to break above the descending triangle resistance and the 100 SMA dynamic inflection point, the pair could rally by roughly 200 pips from the breakout area.
On the other hand, a breakdown below the triangle support at 1.06742 could spur a selloff to the September lows or lower. This would also confirm that sellers are in control and that the longer-term downtrend is resuming.
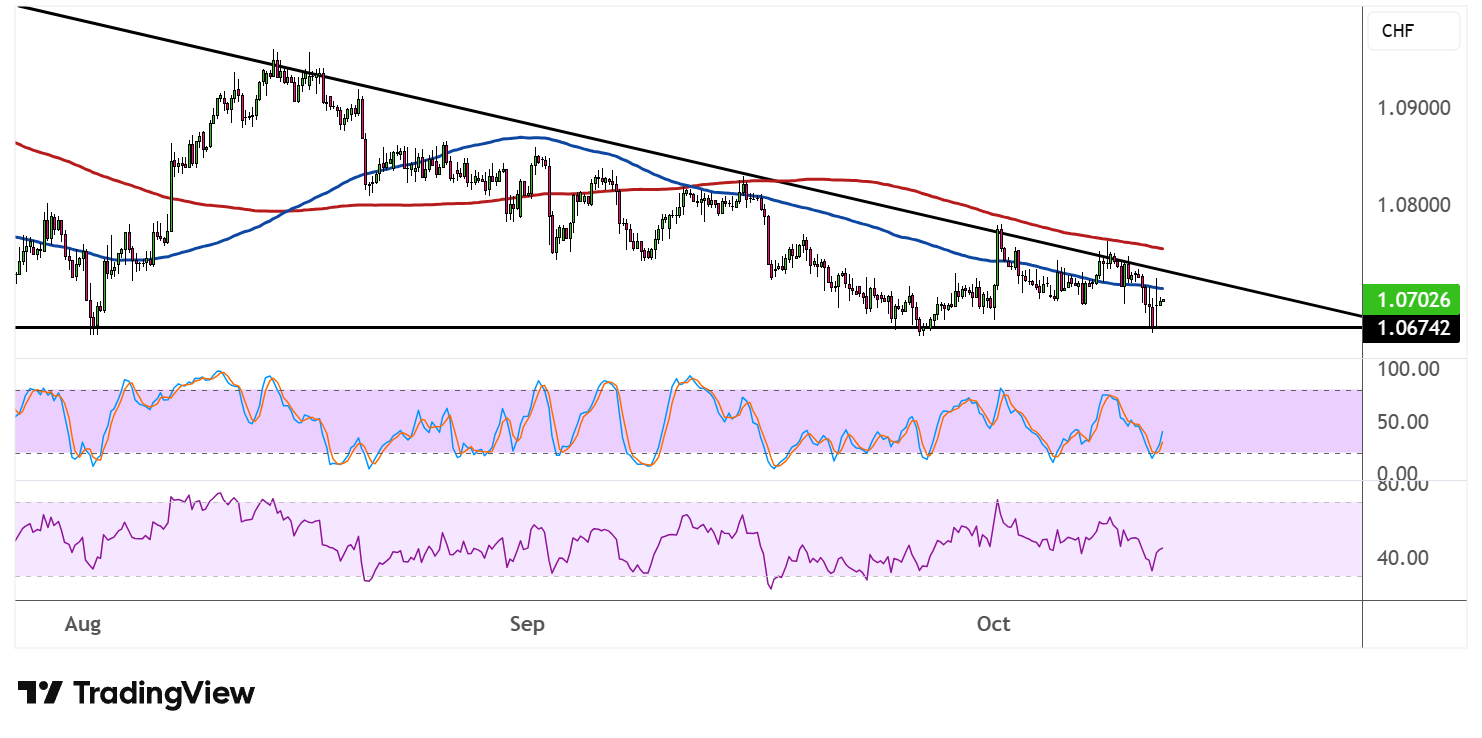
The 100 SMA is still below the 200 SMA to indicate that the path of least resistance is to the downside or that there’s a chance the selloff could gain momentum. Price is currently wedged between both moving averages, which suggests indecision in the market for now.
Stochastic is hovering around the middle ground, showing that bulls and bears are evenly matched. The oscillator could provide directional clues once it breaks out of its current range, with a move to the upside reflecting bullish momentum and a drop to the downside suggesting bearish pressure.
RSI is also trading close to the centerline, so price could follow the oscillator’s lead. A move to the upside would indicate that buyers are gaining the upper hand while a drop would suggest that sellers are taking control.
Upcoming UK jobs data could trigger a big move, as an upside surprise could cement the BOE’s relatively hawkish bias and bring more upside versus the franc weighed down by SNB intervention threats.