
GBPNZD has been trading within a well-defined sideways range for several weeks, with the pair currently challenging the upper boundary of this consolidation pattern around the 2.2600-2.2680 resistance zone.
The currency cross appears to be building momentum for a potential breakout attempt after an extended period of range-bound price action.

The technical structure shows a clear horizontal resistance level that has repeatedly capped upside attempts, coinciding with previous swing highs that have established this zone as a significant barrier. Price action has respected this ceiling multiple times, creating a well-defined area where sellers have consistently emerged to defend against bullish advances.
On the downside, support can be found around the 2.2377 level, which has provided a solid floor during the recent consolidation phase. This support zone has been tested on several occasions and has held firm, indicating that buyers remain active at these lower levels.
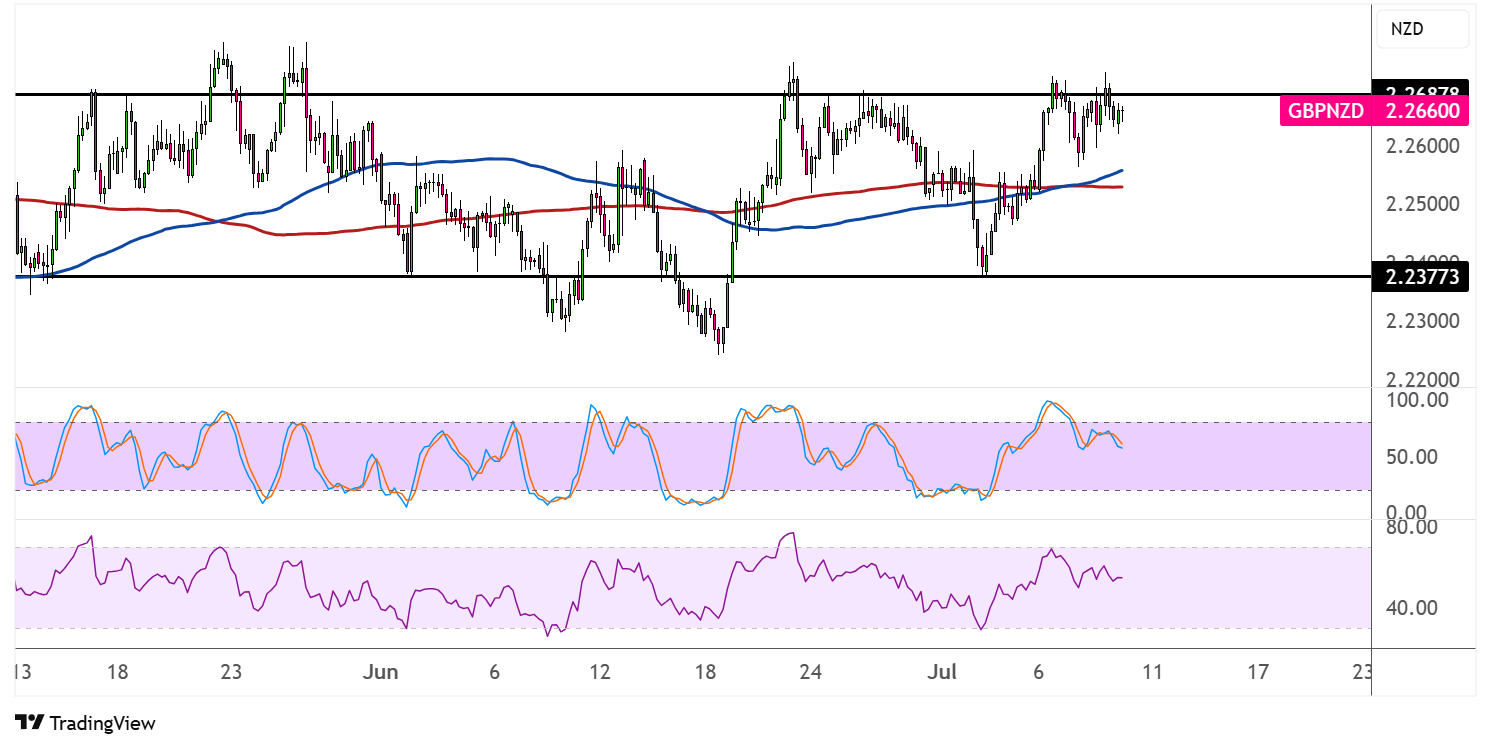
The moving average configuration presents a neutral to slightly bullish bias, with the 100 SMA and 200 SMA converging around the middle of the range. This convergence suggests that the market is in a state of equilibrium, with neither bulls nor bears having a decisive advantage. However, the recent price action above both moving averages indicates that momentum may be shifting in favor of the bulls.
Technical oscillators reflect the range-bound nature of recent price action. The stochastic indicator is approaching the overbought region, suggesting that buying pressure has intensified as the pair tests resistance. However, the oscillator hasn’t reached extreme levels, leaving room for further upside momentum if a breakout materializes.
The RSI is similarly positioned in the upper half of its range, indicating that buyers maintain control but haven’t reached exhaustion levels yet. A decisive break above the 2.2680 resistance could trigger a more significant rally, while failure to clear this hurdle might result in another retreat toward range support.