
GBPUSD is currently trading around 1.3117, showing signs of a bearish correction to the longer-term descending trend line connecting highs since mid-September. The pair appears to be in a pullback phase, bouncing off the swing low near the 1.3000 major psychological mark.
Price could encounter resistance from the descending trend line, which could prove to be a significant obstacle for bulls attempting to extend the recovery further. The Fibonacci retracement tool reveals key levels that could attract more sellers to sustain the downtrend.

The 38.2% Fib level is located at 1.3187, followed by the 50% retracement at 1.3241. A larger correction correction could push GBPUSD toward the 61.8% Fib at 1.3296, while a break above the trend line and potential trend reversal could initially target the 100% level at 1.3473.
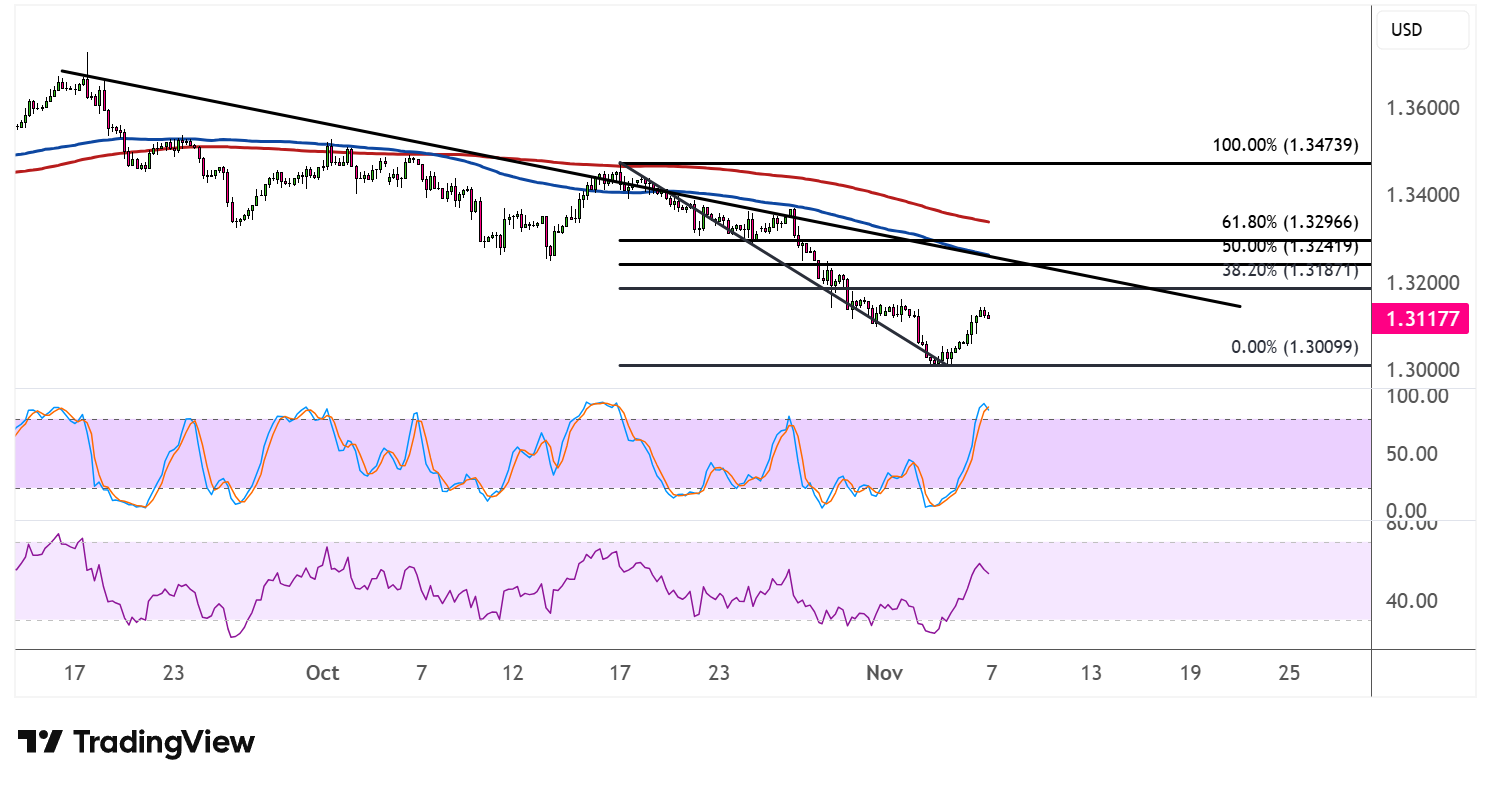
The 100 SMA (red line) is positioned below the 200 SMA (blue line), confirming that the path of least resistance remains to the downside or that bearish momentum could still dominate the broader trend. Both moving averages are converging with the descending trend line and Fibonacci levels, creating a confluence of resistance that could keep gains in check.
Stochastic has climbed into the upper zone, indicating that buyers have regained some control in the near term. However, the oscillator is approaching overbought territory, suggesting that bullish momentum could start to wane. A reversal from these elevated levels would signal renewed selling pressure.
RSI is also trending higher but has room to climb before reaching the overbought zone, which means the corrective rally could extend further in the sessions ahead.
GBPUSD traders should monitor whether the pair can sustain a break above the descending trend line resistance. Failure to do so could trigger another leg lower toward the 1.3000 psychological support, while a decisive break higher would open the door to the next upside targets past 1.3400.