
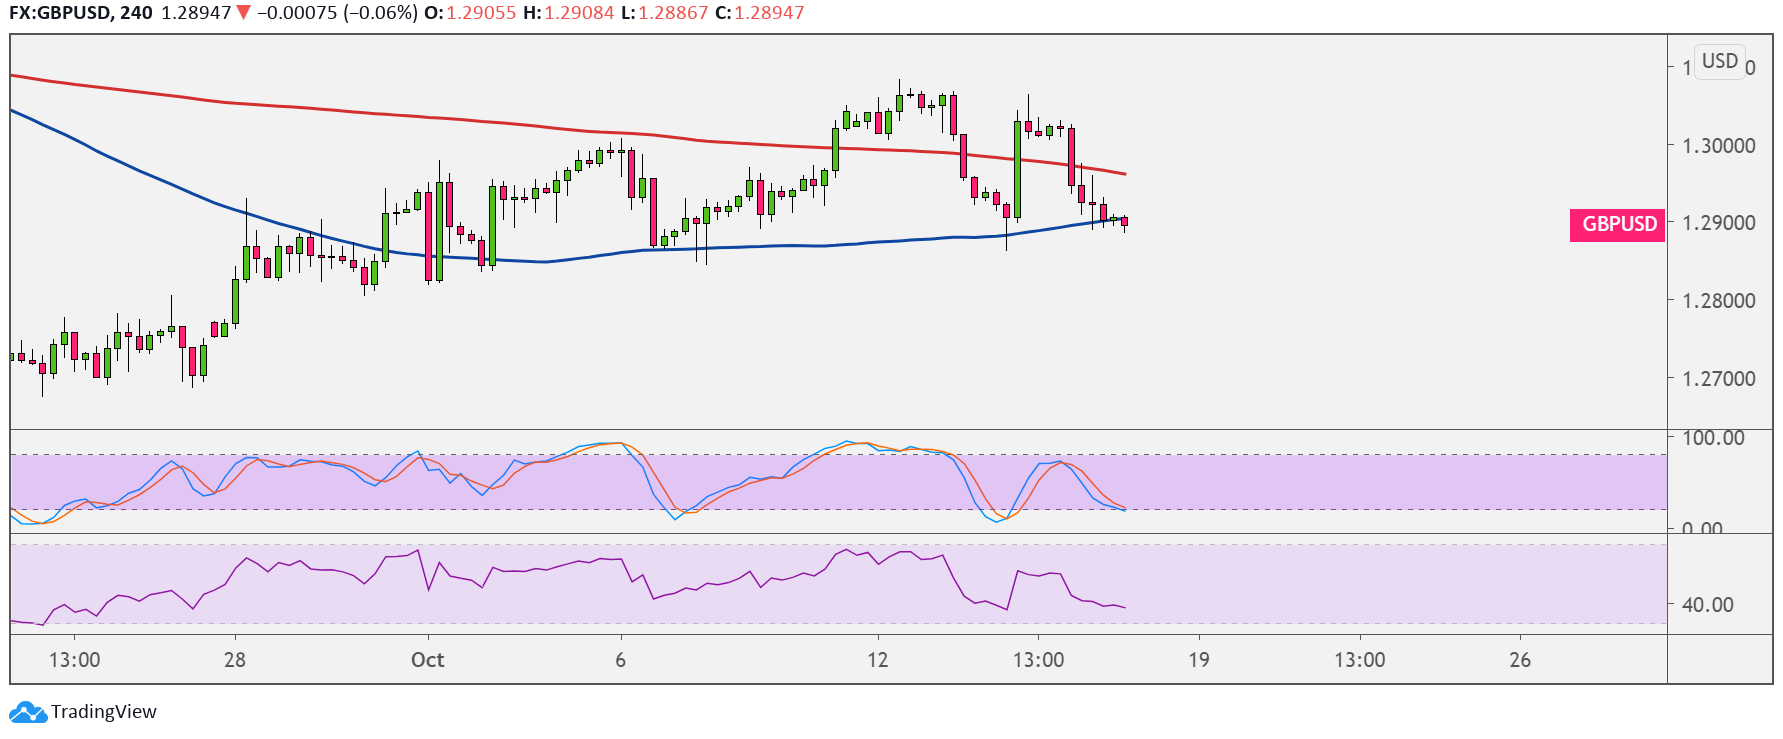
GBPUSD could be done with its climb as price forms a head and shoulders pattern on its 4-hour chart. Price has yet to break below the neckline around the 1.2900 major psychological mark to confirm the reversal.
If that happens, a selloff of the same height as the chart formation could follow. The head and shoulders spans around 150 pips from 1.2900 to 1.3050. Price has yet to break below the 100 SMA dynamic support as well to confirm that sellers are in control.

On the subject of moving averages, the 100 SMA is below the 200 SMA to indicate that the path of least resistance is to the downside. In other words, support is more likely to break than to hold. Then again, the gap between the indicators is narrowing to reflect slowing selling pressure and a potential bullish crossover.
Stochastic is still treading lower to show that sellers have the upper hand, but the oscillator is already closing in on the oversold region to signal exhaustion. Turning back up could mean that buyers are about to take over and possibly take GBPUSD back up to the highs at the 1.3050 minor psychological mark.
RSI has more room to move down, so sellers could stay in control for much longer and have enough energy to sustain a downtrend.
GBP could be under downside pressure as the EU Summit has yet to deliver conclusive decisions related to Brexit. The lack of any formal agreement among leaders on key issues could keep uncertainty hanging over the UK economy, which is already reeling from a resurgence in COVID-19 cases and the possibility of stricter lockdown measures.
Meanwhile, the dollar could draw cues from the upcoming US retail sales release. Analysts are expecting the headline figure to accelerate from 0.6% to 0.7% and the core reading to dip from 0.7% to 0.4%.