
GBPUSD has recently pulled back from its highs near 1.3490, indicating a potential corrective move within the broader uptrend. The pair is currently testing key Fibonacci retracement levels that could provide significant support zones for buyers.
After reaching a local peak, price has declined close to the 38.2% Fibonacci retracement level around 1.3153, which could provide initial support. If selling pressure continues, the 50% retracement at 1.3068 and the 61.8% level at 1.2983 could serve as the next key support zones. The 61.8% Fib level is particularly significant as it coincides with a previous resistance zone that might now act as support.

From a trend perspective, GBPUSD maintains its bullish structure on the daily timeframe, as evidenced by the series of higher lows and higher highs since March. The blue 100 SMA remains above the red 200 SMA, confirming that the path of least resistance is to the upside.
Both moving averages are sloping upward, reinforcing the bullish bias. The pair is also trading above an ascending trendline that has been supporting price action since early March.
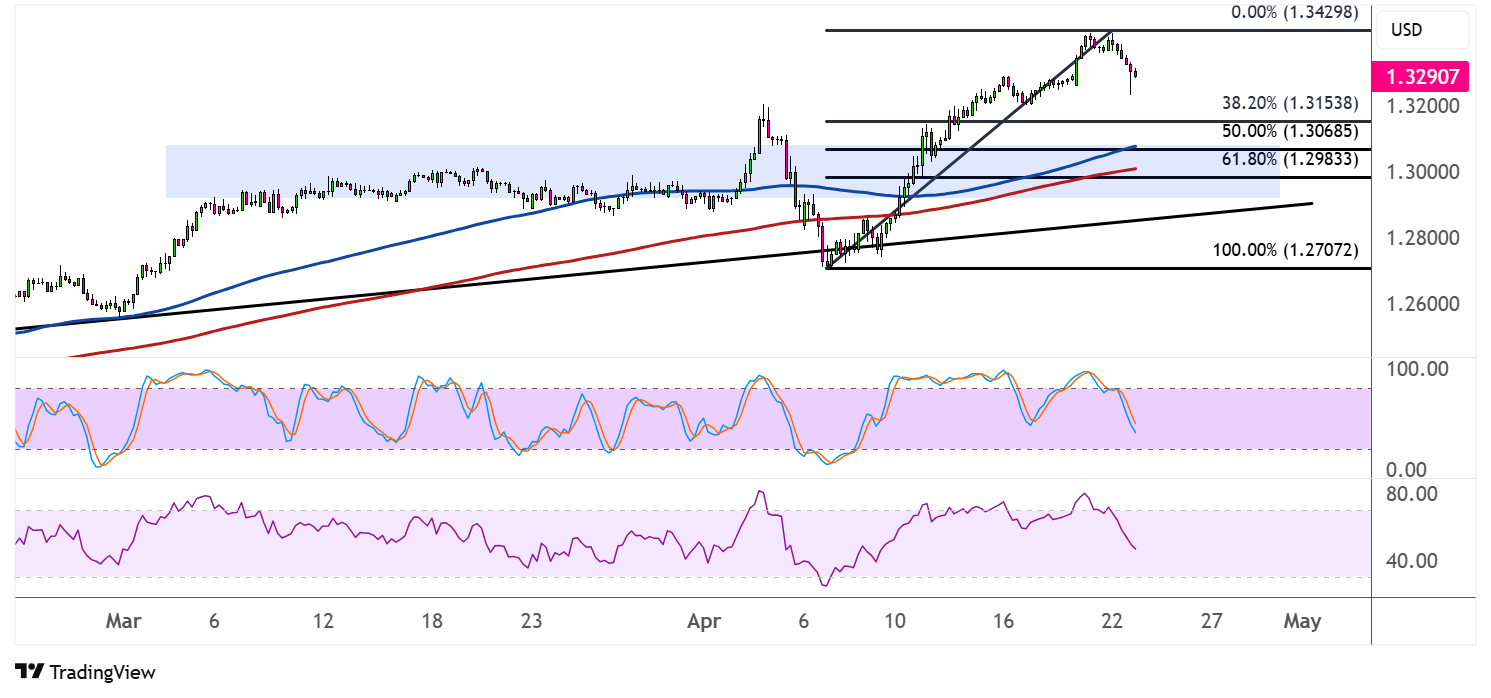
However, momentum indicators are suggesting some caution. The stochastic oscillator is heading south from overbought territory, indicating that bearish pressure could persist in the near term. Similarly, the RSI has turned lower from elevated levels and has room to decline before reaching oversold conditions.
Looking forward, if the current pullback finds support at any of the mentioned Fibonacci levels, GBPUSD could resume its uptrend toward the recent highs and potentially target the 1.3600 area. Conversely, a breakdown below the 61.8% Fibonacci level and the ascending trendline could signal a deeper correction toward the 100% retracement at 1.2707.
While the US dollar has been on the back foot in the past weeks owing to uncertainties in trade and monetary policy, a bit of a relief was seen in the latest sessions thanks to reassuring remarks from the US Treasury Secretary.