
GBPUSD has been carving out lower highs and lower lows within a well-defined descending channel on the short-term time frame.
The pair is currently testing resistance around the channel’s upper boundary near the 1.3350 minor psychological level. Price appears to be stalling at this zone, suggesting that the broader downtrend could be ready to resume.

The Fibonacci extension tool highlights where sellers could be aiming. The 38.2% Fib sits at 1.3366, followed by the 50% level at 1.3330, which is closer to where price is currently trading.
A larger drop could reach the 61.8% Fib at 1.3295, while the 76.4% level at 1.3251 represents a deeper slide. If bearish momentum picks up convincingly, the full Fibonacci extension target at 1.3180 could come into scope as the next major downside objective.
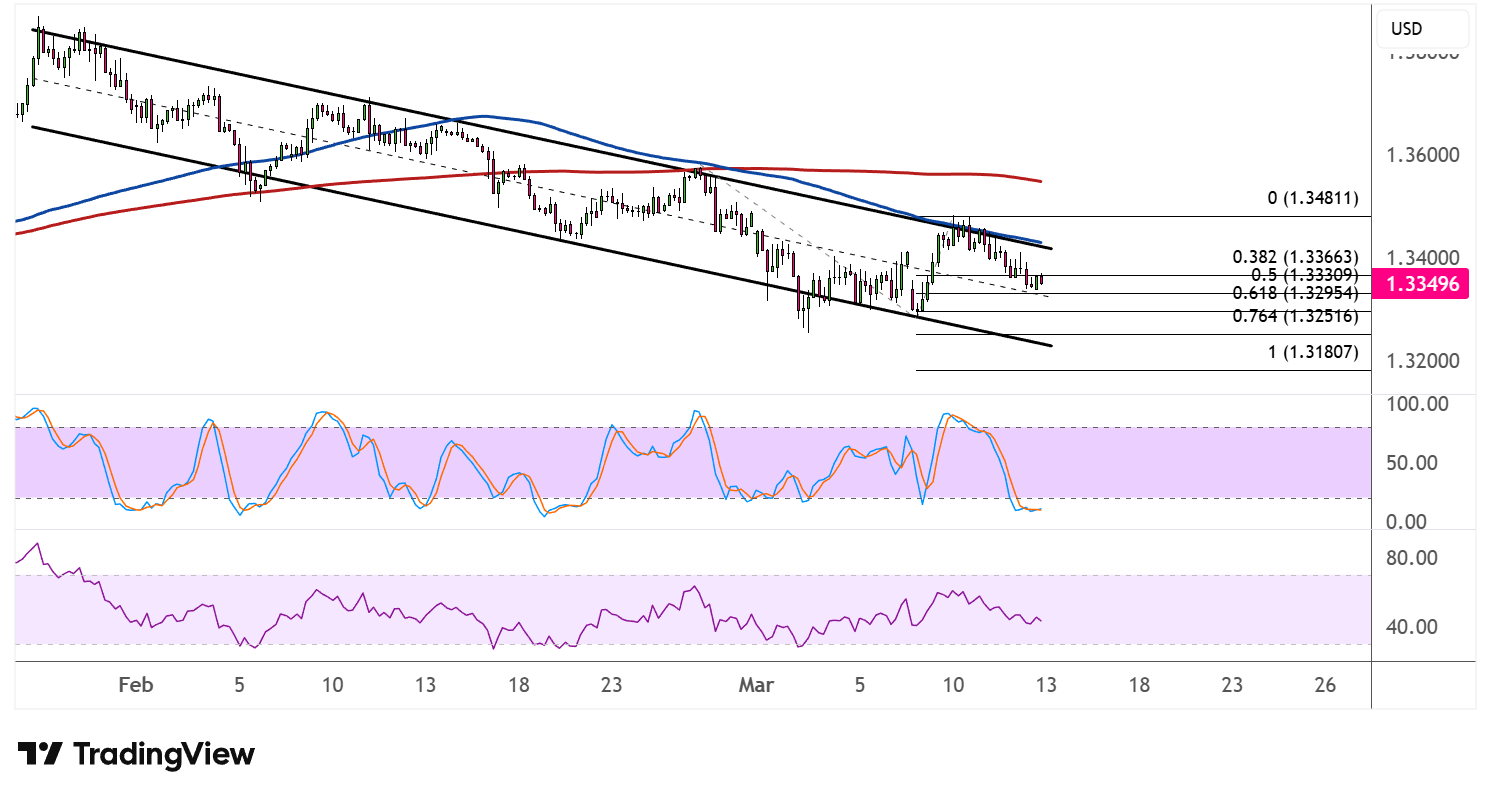
The 100 SMA has crossed below the 200 SMA to confirm that the path of least resistance is to the downside and that the selloff is more likely to gain traction than to reverse. Both indicators are sloping lower and hovering above price, reinforcing their role as dynamic resistance on any bounce attempts.
Stochastic has turned sharply lower from the overbought zone, reflecting a return in selling pressure after the brief recovery. The oscillator has plenty of room to slide before reaching the oversold area, suggesting that bearish momentum could build steadily from here.
RSI, on the other hand, remains below the midpoint and appears to be rolling over after a modest recovery attempt. The indicator has plenty of ground to cover before reaching oversold conditions, meaning sellers could stay in control for an extended move lower.
If the descending channel resistance and Fibonacci levels hold as a ceiling, GBPUSD could resume its slide toward the extension targets. A sustained break above 1.3481, however, would invalidate the bearish setup.
GBPUSD could take cues from overall market sentiment and USD safe-haven demand, as geopolitical headlines have been dominating price behavior.