
Gold time for a correction?
Gold prices break loose on a bullish streak since November last year from $$1,195 low to reach $1,325 in January. The price has yet lost its bullish pressure but correction might be due. If a correction happens the gold expected to move down to test $1,280 – $1,300 area.
Recent The Fed interest-rate decision is a game changer in the global market. The Fed cited they are patient on the future rate-hike which mean no rate-hike at least until second or third quarter. It is a bullish confirmation for U.S dollar counterpart. However, the market will continue to watch development on U.S-China trade wars and UK Brexit to get a further clue on global market direction.

Gold has a lot of opportunities this year as major news developing across the world. We expect more upside in the precious metal until all major news settled.
Click here to see Gold December 2018 forecast.
New Month
Monthly Chart
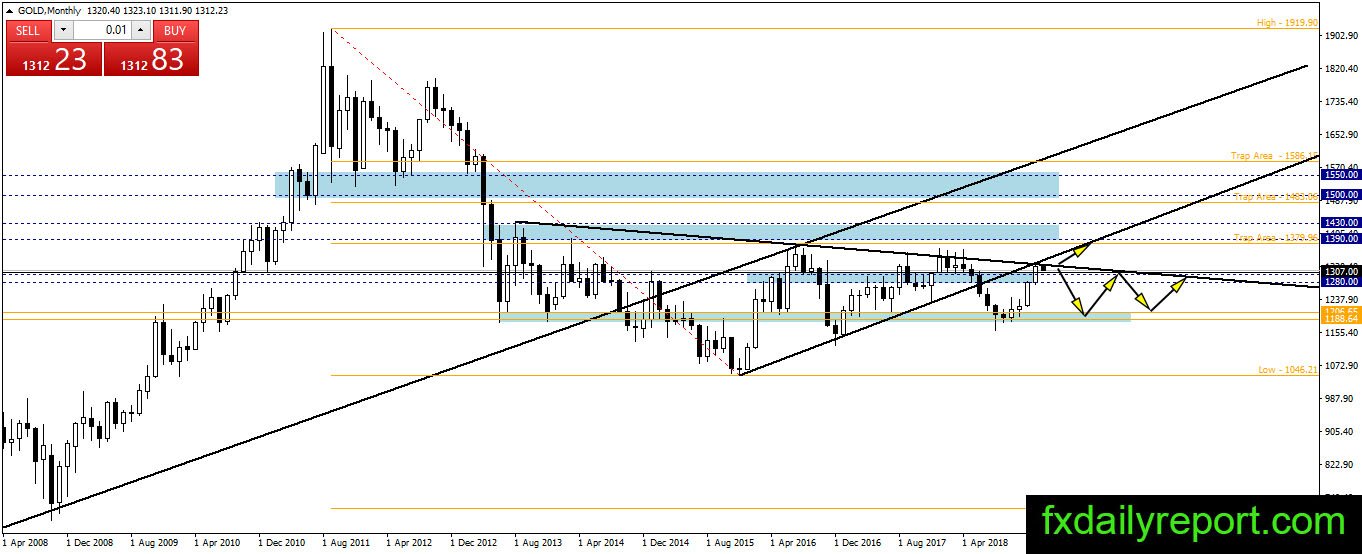
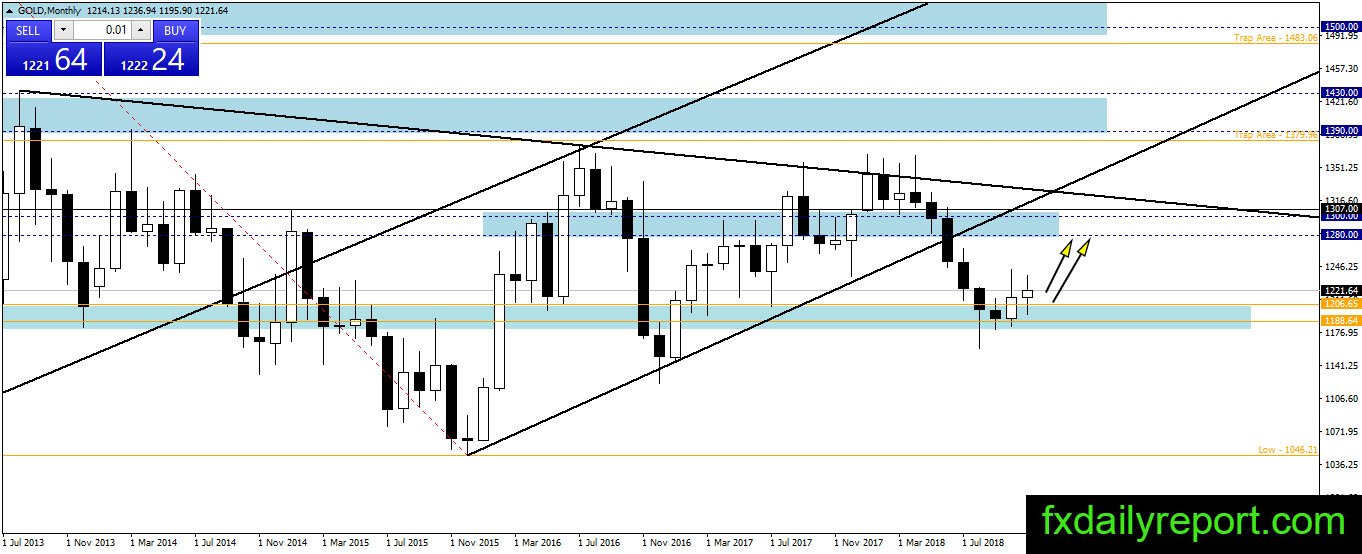
Gold bounce from $1,188 – $1,200 area brought the precious metal upward and reach target area $1,280 – $1,300. Currently, we have bearish trendline resistance to break. Will gold bull manages to break the resistance? Alternatively, will it close below $1,280 and start new bearish leg to test $1,188 – $1,200 again?
Weekly Chart
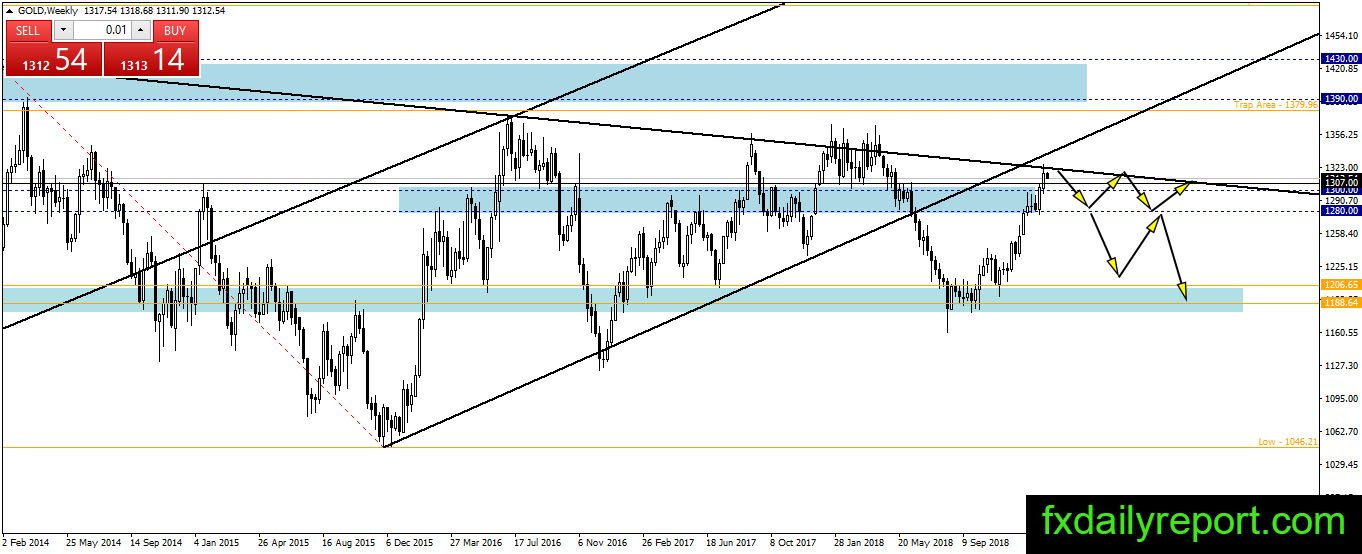
The situation on the gold weekly chart is similar to the monthly chart. The precious metal currently challenging the bearish trendline and waiting for next direction. If the price making a correction then we expect $1,280 – $1,300 will become the area to watch for a bounce.
A breakout below $1,280 will trigger selling and possibly new bearish leg.
Daily Chart
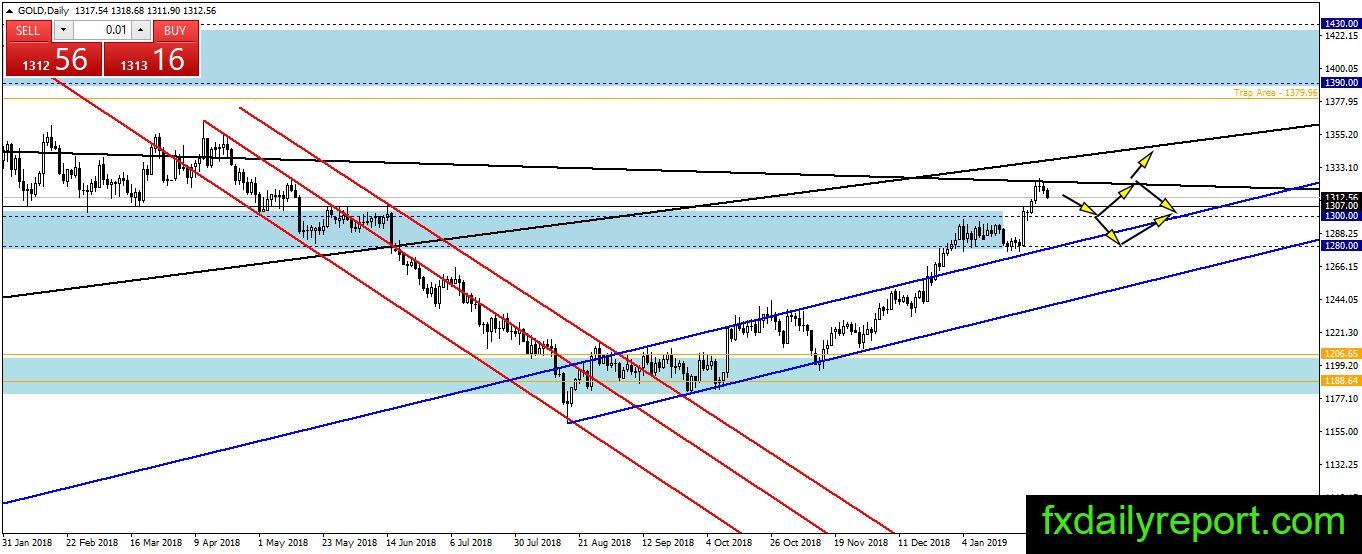
The situation on the daily chart is bullish and follow the outlook on the weekly and monthly chart. Our expectation is a test on $1,280 – $1,300 will happen.
Trade Plan
Bullish trade – Traders could use $1,280 – $1,300 area to look for long positions.
Bearish trade – Short position could be taken near the bearish trendline shown on all charts above. Another short position to consider is short when breakout below $1,280 happen.