
The gold price on Thursday pulled back off the current 3-week highs of about $1,590 to trade at $1,575 following the latest round of economic data. The yellow metal appears to be experiencing a bumpy bull-run with several pullbacks along the way. This could continue through next week when the US non-farm payrolls for January are announced.
The price of the yellow metal continues to trade within a consolidative wedge and has recently pulled off overbought levels of the RSI indicator.
Gold Price Fundamentals Overview

From a fundamental perspective, gold is trading at the back of a busy period in the global markets. The coronavirus continues to menace the Asian markets. In the last few days, Asian equities have plunged, and now there are fears this could affect European and North American equities. This has seen a relative influx in safe-haven investors. The price of gold benefited from this paradigm shift, but the momentum has deteriorated.
Besides this, the US economic data came out mixed this week. On Tuesday, durable goods orders ex-transportation missed estimates. The ex-defense equivalent also disappointed while non-defense capital goods for December missed 0.0% with -0.9%. And on Wednesday, the Federal Reserve added more pressure to the equities markets when it kept the Funds rate unchanged at 1.75%.
The initial jobless claims failed to meet expectations on Thursday missing by 1k while continuing claims impressed with 1.703M versus 1.733M. The preliminary Q4 GDP missed 1.8% with 1.5% but met expectations on an annualized basis.
Gold Price Technical Analysis (the 60-min Chart)
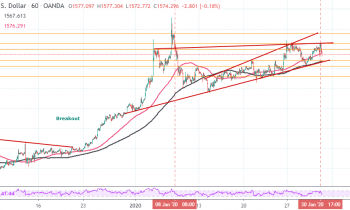
Technically, the price of gold appears to be trading in a consolidative sideways wedge with a slight bullish bias. The yellow metal hit overbought levels earlier this week, but Thursday’s pullback pushed it back to the normal trading range.
Therefore, the bulls will be targeting short-term profits at around $1,579 or higher at $1,585 going into Friday. On the other hand, the bears will hope that the pullback continues towards $1,568 or lower at $1,552.
Gold Price Technical Analysis (the Daily Chart)
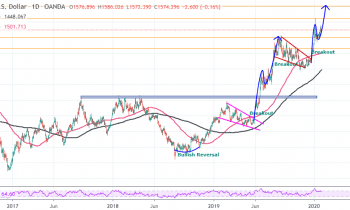
In the daily chart, the gold price appears to be experiencing strong bullish pressure after the most recent pullback bottomed at $1,540. Gold could now rally towards $1,650, which would set a new multi-year high. However, the yellow metal is still locked in the overbought levels of the RSI indicator and this could trigger another pullback.
Therefore, the bulls will target long-term profits at around $1,611 or higher at $1,650. On the other hand, the bears will target the next pullback at around $1,550 or lower at $1,516.