
HD Long-term outlook
Home Depot (NYSE: HD) brought major problem for the bear as share prices print new record high in November. The company said it overcome hurricanes attack which happens in last quarter. HD reported earnings per share of $1.84 vs. $1.81 expectation. Revenue comes out at $25.03 billion vs. $24.47 billion expectation.
Strong result encouraged the company to raise full-year guidance. Now the company sees 2017 EPS at $7.36, 7 cents higher than the previous estimate of $7.29. Fundamentally, there is nothing to stop HD on the upside for now, but correction might be due.

Click here to see HD October analysis
New Month
Monthly chart
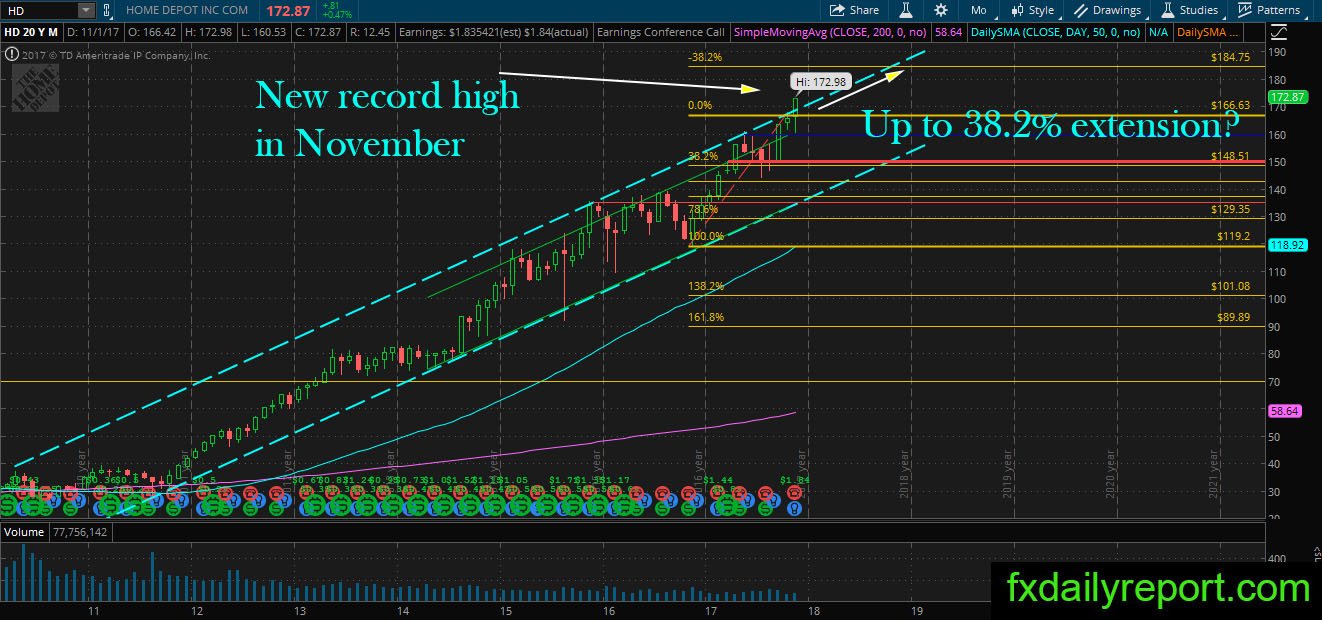
The trend on monthly chart extremely bullish for HD as the share prices print new record high in November. There is no sign of stopping yet from the bull, and the share prices might extend its upward movement toward the 38.2% Fibonacci extension.
Weekly chart
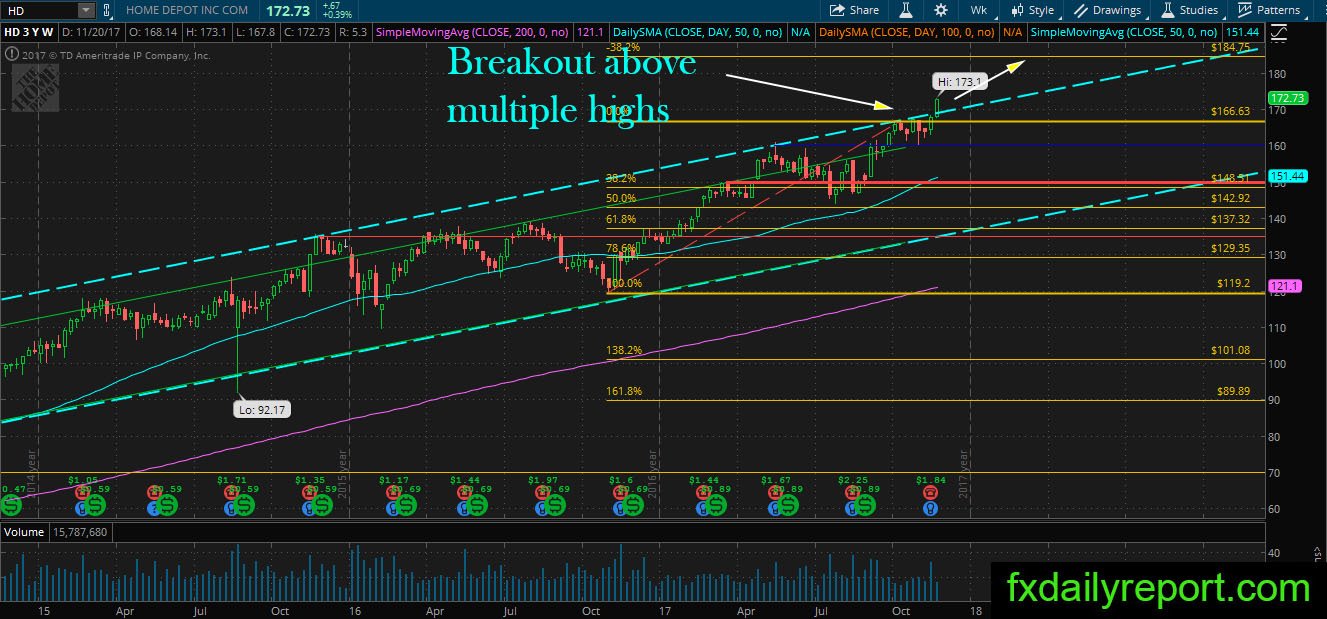
HD on the weekly chart broke through multiple highs resistance. The share prices now have area between $166.50 – $167.50 as support. Traders could look for long position near the support level.
Daily chart
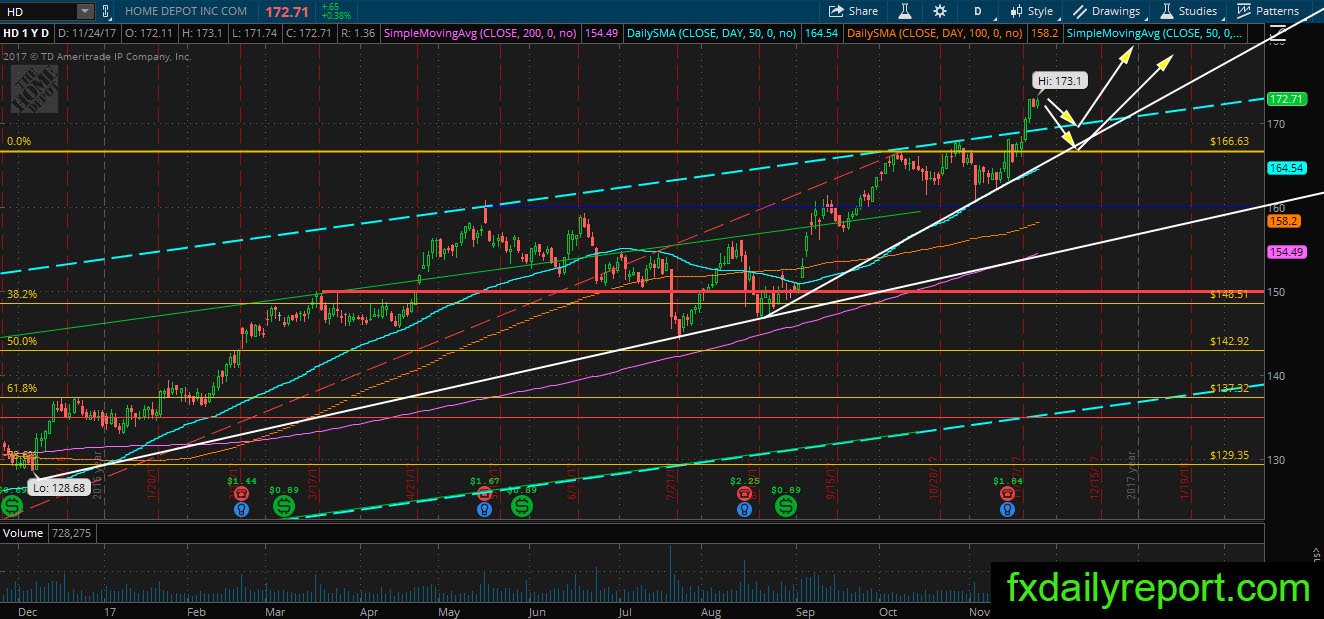
The daily chart of HD has the same outlook as the weekly and monthly chart. The share prices have top of the channel as support, and below the channel, there are trend line and level around $166.63 as support. No change to the bullish outlook and it is better for traders to trade long position on a pullback.
Trade plan
The bullish position could be taken near the breakout level shown on the weekly and daily chart. $166.50 – $167.50 is the area to watch.
There is no bearish setup to watch for now. Wait until major reversal happens and turn HD trend into bearish.