
HD Long-term outlook
There is not much change in HD outlook. The trend continues bullish, and it is better to avoid holding a short position. HD print new record high in September, the share prices move up from $150.26 to $163.61. It is a strong month with almost Marubozu pattern close. The share prices continue to move higher in October, currently traded at $165.81 after reach record high $166.63.
There might be limited upside for the bullish move as HD scheduled to report earnings on 14th November before market open. Under current situation, it is better for trader to stay sideline and wait for retracement to enter long position.

Click here to see HD September analysis
New Month
Monthly chart
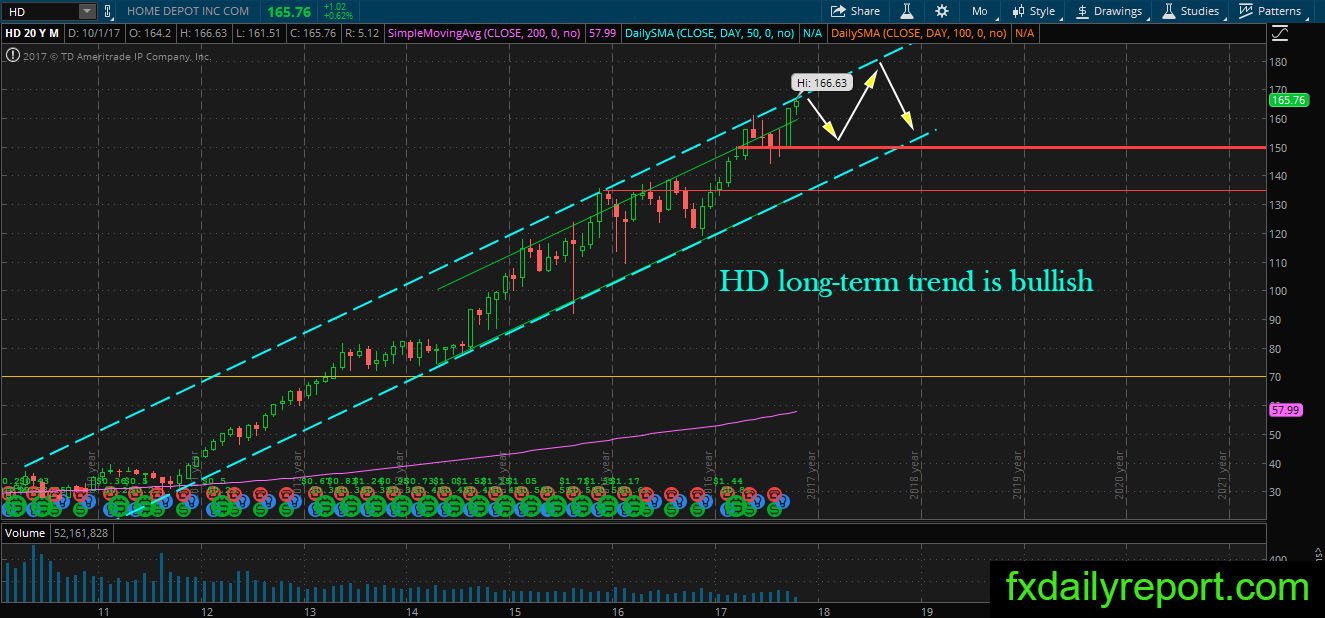
HD is not giving an inch for the bear as the share prices print new record high in October. There is no change to the current outlook, and the share prices could continue print new record high. If HD retraces from current level, it will target red horizontal line around $150.00 where traders could look for long position.
Weekly chart

HD weekly chart confirms the support level on monthly chart. The latest Fibonacci retracement show 38.2% retracement settle at $148.51. Traders could use $148.51 – $150.00 as buying guidance when the share prices move down.
Daily chart
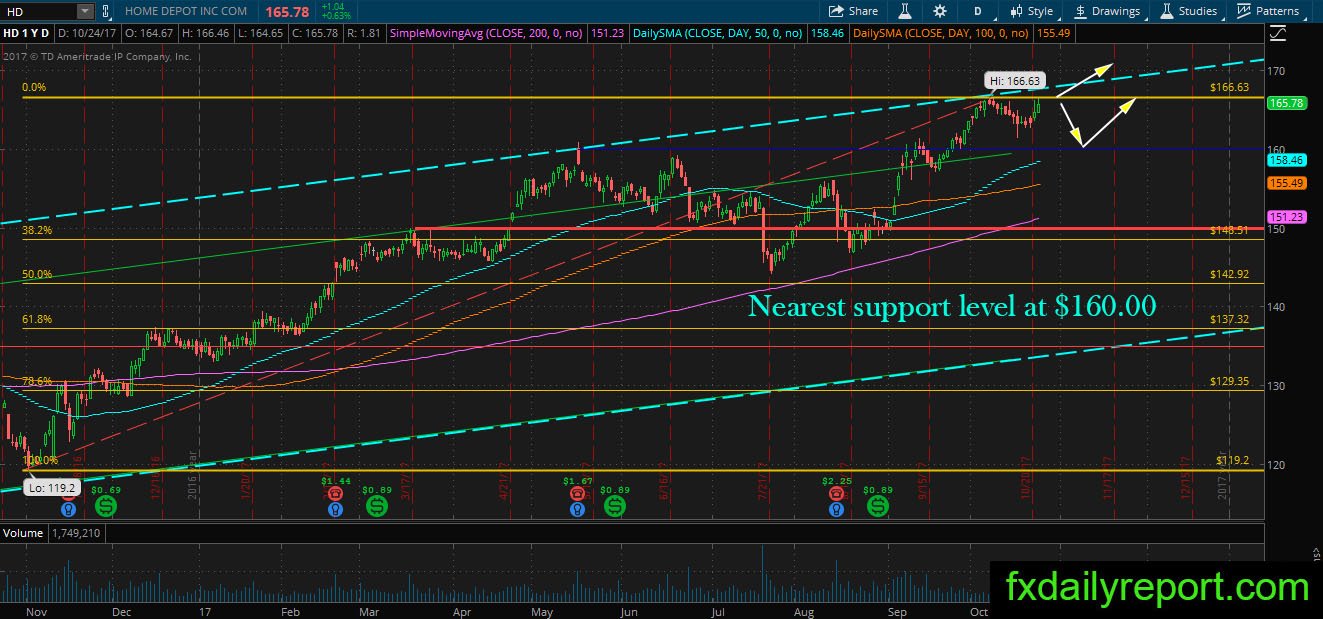
Lower on the daily chart, there is closer support level at dark blue horizontal line around $160.00. Traders could look for short-term long position at this support level.
Trade plan
The bullish position is better taken from dark blue horizontal line located on the daily chart at $160.00.
The bearish position needs to wait for a failure to break higher above $166.63 record high.